
A primer on the ROS hypothesis of obesity
Introduction
Reactive oxygen species (ROS)
ROS and insulin
ROS and the insulin signaling cascade
Mitochondrial ROS generation
DPsim-generated ROS: a brief overview of OXPHOS
DPsim-generated ROS
Beta-oxidation-generated ROS: a brief overview of beta-oxidation
Beta-oxidation-generated ROS
Key points
Further reading and resources
Introduction
This primer serves as a companion to The ROS hypothesis of obesity. To understand the mechanisms behind the ROS hypothesis, one must familiarize oneself with the physiological role of ROS, its involvement with insulin and insulin signaling, and how mitochondria generate ROS.
Reactive oxygen species (ROS)
Reactive oxygen species (ROS) are a large family of oxygen-derived molecules that are more reactive than oxygen itself. Two of particular interest to the ROS hypothesis are superoxide (SO), a core ROS produced constantly during normal metabolic processes, and hydrogen peroxide (H2O2), a much more persistent byproduct of SO in the environment.
ROS have long been recognized as toxic, and they certainly can be, depending on the degree, type, and context. For example, they’re produced by white blood cells like macrophages and kill invasive microorganisms. Another example is radiotherapy, a cancer treatment that induces ROS production, causing oxidative distress that leads to cell death. However, ROS are now well recognized as signaling molecules essential to normal physiology.
Further reading and resources:
- Mittler, 2017 | ROS Are Good
- Milkovic et al., 2019 | Short Overview of ROS as Cell Function Regulators and Their Implications in Therapy Concepts
ROS and insulin
Most metazoans have developed and use insulin or insulin-like substances and insulin receptors to regulate growth and reproduction. Plants, yeast, and protozoa also possess functionally similar systems that are phylogenetically completely distinct from the insulin system. All four of these non-related signaling systems will interact with each other. For example, you can extract an insulin-like substance from a plant — which has nothing to do with insulin (it’s just “insulin-like”) — and apply it to the adipocyte of a rat. It will react in the same way as it would if you treated it with rodent (or human) insulin. You can also take human insulin, add it to yeast cells — which do not possess anything resembling an insulin receptor — and it increases glucose uptake and growth in the same way it would in a mammalian cell.
The simplest explanation for these observations is convergent evolution: the independent evolution of similar features in species of different lineages. Insulin or insulin-like signaling systems in metazoans, plants, yeast, and protozoa all serve similar roles in growth, nutrient sensing, and metabolic regulation, despite being phylogenetically unrelated and having different molecular origins. These systems are functionally analogous but structurally and genetically distinct.
Furthermore, these unrelated systems can interact or cross-activate with each other. They not only have biochemical similarities to one another in their intracellular response, but you can replace one for the other and induce the same response across eukaryotes. This points to biochemical convergence through a shared underlying mechanism. That underlying mechanism is likely ROS signaling.
You can experimentally replace insulin with a source of ROS or by direct application of H2O2. In adipocytes, for example, glucose uptake, oxidation, incorporation into fatty acids, and inhibition of lipolysis — the effects you would expect from insulin — can all be mimicked by H2O2. (After you’re done reading this section, you may consider that H2O2 is not an insulin-mimetic; it’s the core signal.) An essential aspect of these findings is that small doses of H2O2 stimulate insulin-like effects, while larger doses are inhibitory. We’ll discuss this in greater detail in the following section.
But does ROS signaling extend even further back than eukaryotes? After all, eukaryotes derived from two prokaryotes: an archaeon that swallowed a bacterium — which we now call mitochondria — roughly two billion years ago, and lived together happily ever after. While two billion years may seem like a long time (because it is), prokaryotes predate eukaryotes by about the same amount of time (another 1.5-2 billion years).
Based on genome analyses, ROS-scavenging enzymes are thought to have evolved alongside the first atmospheric oxygen molecules about three to four billion years ago, tracing back to the Last Universal Common Ancestor (LUCA), the hypothesized ancestor of all life on Earth. It is assumed that once cells learned to deal with ROS toxicity, they were able to utilize ROS for signaling purposes. In other words, life has evolved in the presence of ROS since the beginning.
Bacteria use ROS as signaling molecules. ROS levels are lower during quiescence (i.e., dormancy) and higher during growth or proliferation when nutrients are available. ROS levels revert to levels present during the quiescent period before feeding. Studies have shown that if you suppress the production of ROS using antioxidants, you can supply bacteria with abundant food, yet the bacteria won’t grow: ROS are required in the normal growth of marine bacteria.
Moving back up to eukaryotes — organisms that contain a nucleus and mitochondria — there is still a basic need for ROS production to control growth and reproduction. In humans, ROS signaling determines cell fate — orchestrating quiescence, proliferation, differentiation, senescence, and apoptosis. A study in rats showed that ROS is necessary for satiation. Investigators infused rats with fat into their bloodstream. In response, the rats burned fat in the neurons of their hypothalamus, creating ROS. At the same time, the rats spontaneously reduced their food intake over the next several hours. When the rats were given an antioxidant that blunted the ROS signal, they went back to normal levels of food consumption despite the high levels of circulating fat from the infusion.
Taken together, a strong case can be made that ROS signaling is the evolutionarily conserved process that underpins the insulin or insulin-like systems and their receptors. In other words, complex multicellular organisms utilize insulin and insulin-like systems as an overlay to ROS signaling; the underlying ROS signal remains fundamental. Low concentrations of ROS initiate and facilitate nutrient uptake and utilization to a certain degree, above which there’s negative feedback using the same ROS, which inhibits further uptake and utilization.
Further reading and resources:
- Dobromylskyj, 210118 | ROS (01) Insulins are ubiquitous in eukaryotes
- Dobromylskyj, 230221 | How can insulin resistance cause weight gain? (4) amplification
- Inupakutika et al., 2016 | The evolution of reactive oxygen species metabolism
- Czech et al., 1974 | Evidence for Electron Transfer Reactions Involved in the Cu2+-dependent Thiol Activation of Fat Cell Glucose Utilization
- Hansel et al., 2019 | Tight Regulation of Extracellular Superoxide Points to Its Vital Role in the Physiology of the Globally Relevant Roseobacter Clade
ROS and the insulin signaling cascade
The insulin signaling pathway is a crucial biochemical cascade that helps control cellular metabolism and energy utilization. Before we get into the insulin signaling cascade, it’s important to understand that a certain threshold concentration of insulin is typically needed to effectively activate the insulin signaling cascade at target cells like adipocytes or muscle cells. However, it’s not an all-or-nothing response — the signaling is graded: more insulin generally leads to a stronger signal, but very low levels may not be sufficient to fully trigger downstream effects. So, in the following scenario and series of figures, imagine that we’re looking at a situation in which a fasted individual eats a high-carb meal. Let’s say a big bowl of white rice.
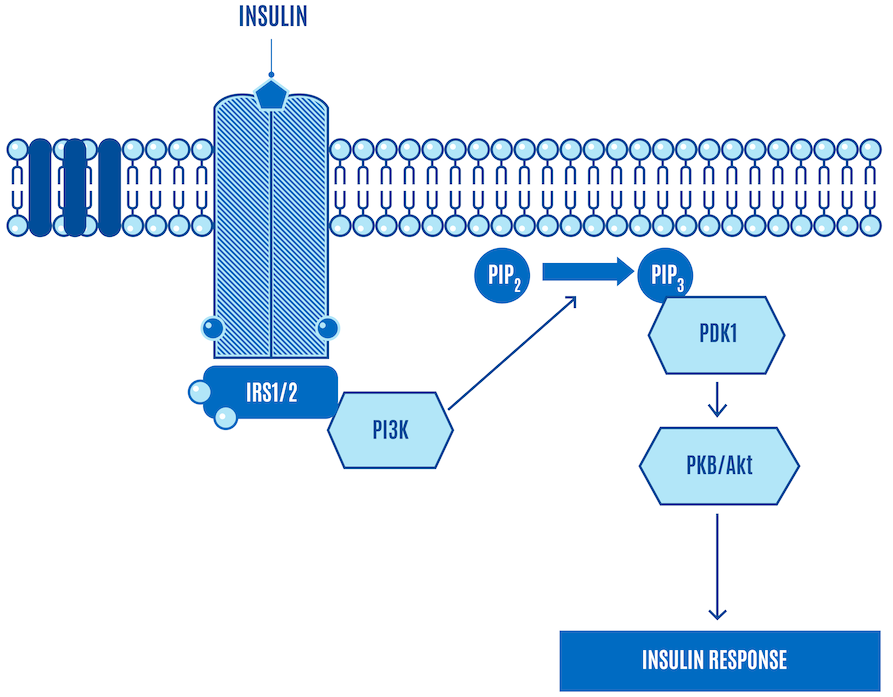
We’ll start with a simplified version of the canonical insulin signaling pathway (Figure 1).
Now let’s walk through what happens (Figure 2). The bullets below provide more detail about the steps in the next couple of figures, but you won’t miss out on anything critical for our purposes if you skip them.
- Insulin release: Insulin is released from the beta cells of the pancreas in response to elevated blood glucose levels.
- Insulin receptor binding: Insulin binds to the insulin receptor, a specific receptor on the cell surface, primarily in muscle, liver, and fat cells.
- Receptor activation: Insulin binding activates the receptor’s intrinsic tyrosine kinase activity. This activity triggers the receptor to add phosphate groups to itself (autophosphorylation) and to other proteins.
- IRS proteins activation: The phosphorylated receptor phosphorylates Insulin Receptor Substrate (IRS) proteins, which serve as docking platforms for other signaling molecules.
- PI3K activation: Phosphorylated IRS proteins activate phosphatidylinositol 3-kinase (PI3K), which in turn converts the lipid phosphatidylinositol-4,5-bisphosphate (PIP2) in the cell membrane to phosphatidylinositol-3,4,5-trisphosphate (PIP3).
- Activation of protein kinase B (PKB or AKT): The increase in PIP3 recruits protein kinase B (PKB, also known as AKT) to the cell membrane, where it is activated through phosphorylation by PDK1 (phosphoinositide-dependent kinase-1).
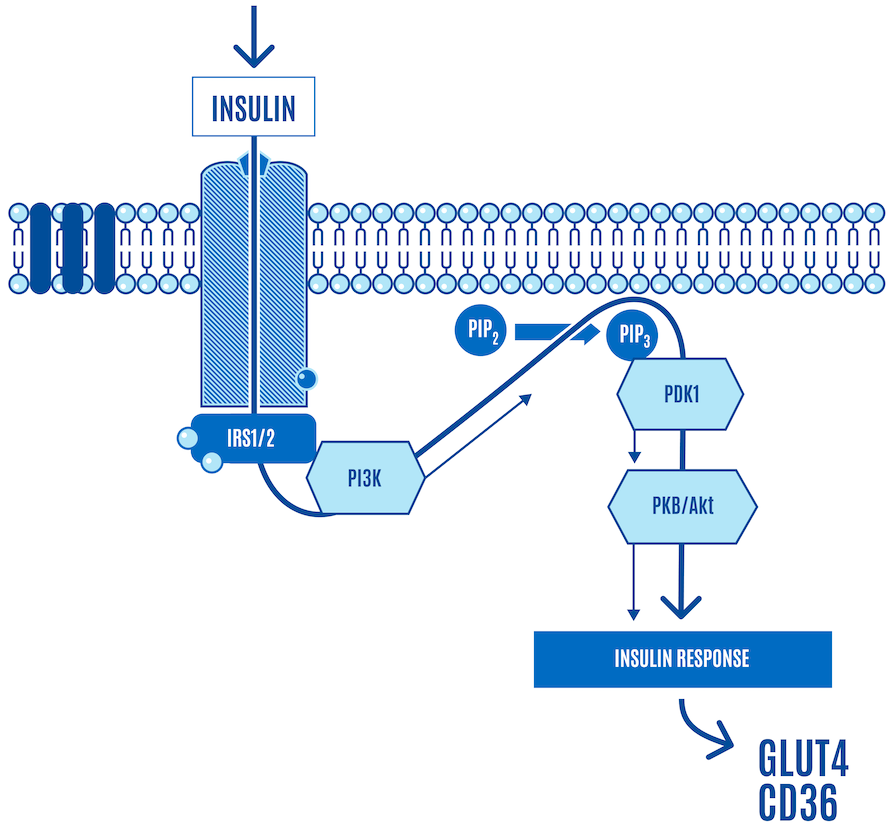
As part of the process, AKT is phosphorylated (denoted as pAKT). This is one of the core signals that activate the translocation of GLUT4 (a glucose transporter) and CD36 (a free-fatty acid, or FFA, transporter) to the cell surface, facilitating nutrient ingress (Figure 3).
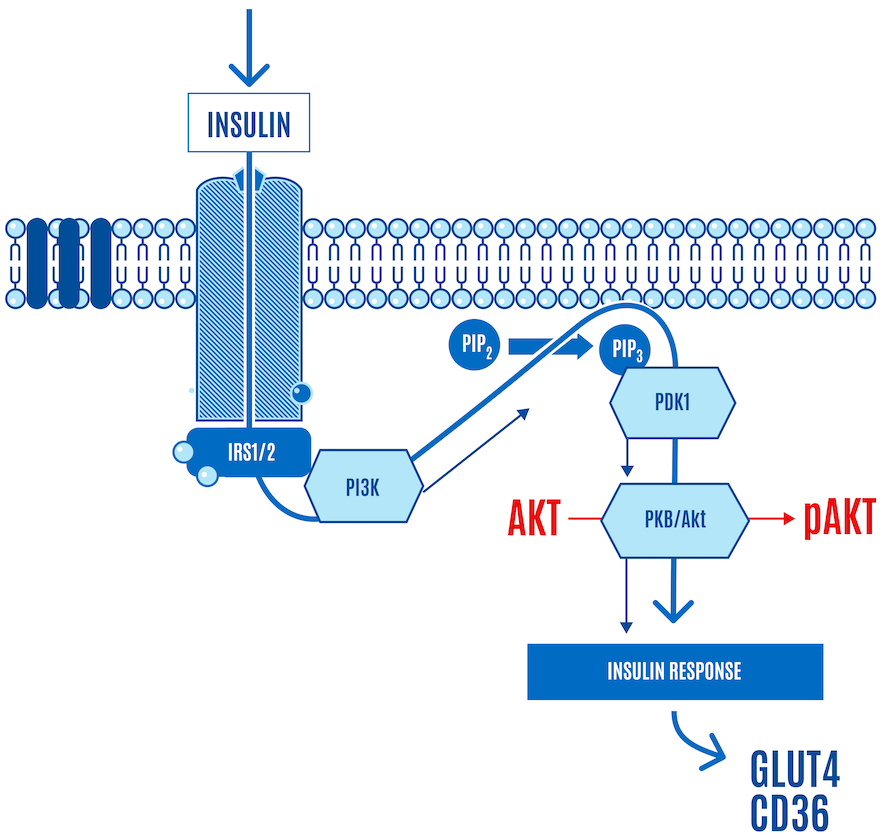
There are several AKTs, and they can be phosphorylated in various places, but the message is:
Insulin → signaling cascade → pAKT → nutrient ingress
Keep in mind that greater levels of insulin lead to a greater magnitude of the insulin signaling cascade, which includes greater phosphorylation of AKT, more GLUT4 translocation to the cell membrane, and more glucose ingress into the cell. Dietary carbohydrates trigger the strongest insulin response, while fat has a minimal direct effect on insulin secretion. When insulin levels are low, during a ketogenic diet, for example, insulin signaling is downregulated, and there’s less insulin-facilitated glucose and free fatty acid (FFA) uptake in cells.
Let’s look at this from our perspective of consuming a big bowl of white rice:
- High consumption of carbs results in elevated blood glucose (BG) concentrations
- Greater levels of insulin are secreted in response to high BG
- Greater levels of insulin secretion result in a stronger activation of the insulin signaling cascade
- The stronger the insulin signaling pathway is activated, the more glucose enters the cells in response.
- When insulin levels are low, during fasting, for example, insulin signaling is downregulated, and there’s less glucose and FFA uptake in cells.
In other words:
- ↑ Carbs → ↑ BG → ↑ insulin & signaling cascade → ↑ pAKT → ↑ glucose ingress
This is all well-described in the literature.
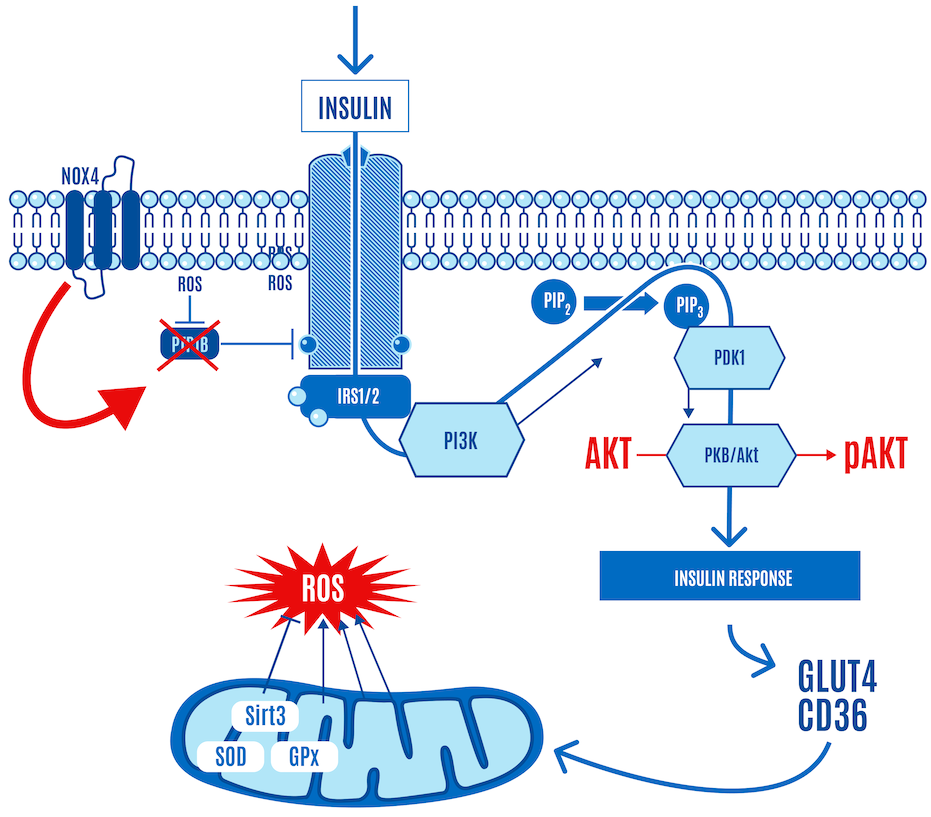
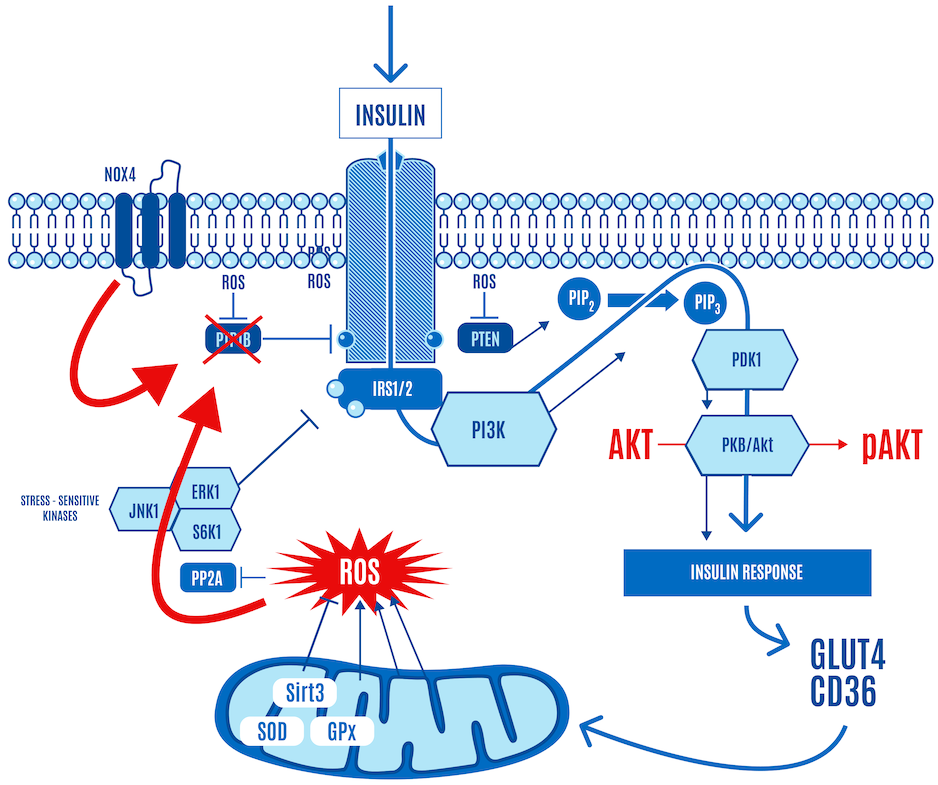
But here’s the part left out of virtually every image or figure you’ve seen of the insulin signaling cascade — the role of ROS. It is now accepted that the insulin cascade trigger is ROS (H2O2) generation by NADPH oxidase 4, also known as NOX4, at the cell surface in response to insulin docking with its receptor (Figure 4). So insulin itself generates a small burst of ROS.
This ROS relieves the inhibition of the insulin receptor by enzymes, such as PTP1B, which allows a response to insulin stimulation. In Figure 4 below, NOX4-derived ROS inhibits PTP1B (shown with an “X” over it in Figure 4). If it sounds like a double-negative, it is. Disinhibition: (ROS) inhibiting a repressor (PTP1B) leads to the activation or facilitation of a process (the insulin signaling cascade).
In other words, low targeted concentrations of ROS triggered by insulin activate insulin signaling. The upshot is that when insulin knocks on the cell door, ROS opens it, allowing glucose and FFAs to enter the cell (Figure 4).

The glucose entering the cell reaches mitochondria, increasing mitochondrial ATP and ROS production along the electron transport chain (ETC) (Figure 5). This is the primary site of ROS production (and ATP synthesis) in the body under normal physiological conditions.
Zooming in on the ETC, the mitochondria increasingly produce more ROS as the ETC fills up on the glucose, meaning that the harnessed electrons from the breakdown of glucose (via glycolysis, pyruvate oxidation, and the Krebs cycle) and FFAs (via beta-oxidation and the Krebs cycle) are used to regenerate more and more ATP from ADP. This is described in more detail in the next section, but it is worth explaining briefly here.
ATP is continuously broken down into ADP, and like a rechargeable battery, ADP is continuously regenerated into ATP. The vast majority of this ATP is produced in the ETC of the mitochondria.
The glucose (and FFA) molecules are broken down in the cell, producing electron carriers along the way. These carriers donate their electrons to ETC complexes in the inner mitochondrial membrane, the site of the ETC (Figures 10 & 11).
As electrons flow through the ETC, protons (H+) are pumped from the mitochondrial matrix to the intermembrane space, creating an electrochemical gradient (ΔΨm or DPsim). Protons flow back into the matrix through a complex called ATP synthase (Complex V), a fitting name because this is where ADP is turned into ATP.
Now let’s come back to our person who ate a bowl of rice after an overnight fast.
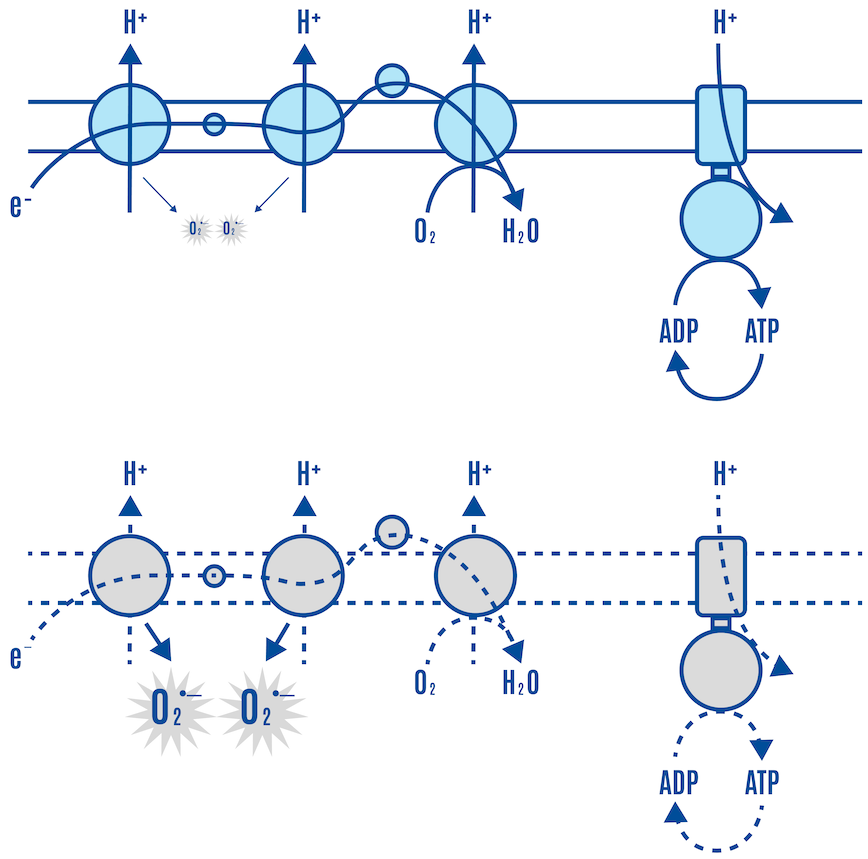
In the fasted state, there can be a relative decline in mitochondrial ATP to ADP, DPsim, and ROS. After the bowl of rice, insulin is signaling and facilitating a load of glucose entering the cell (Figure 5). At first, electron flow down the ETC is relatively fast and efficient, and the oxidation of glucose results in a flood of electrons via their carriers into the ETC. Protons are pumped, and the ATP synthase uses the gradient to make ATP. ETC activity is coupled to ADP availability and DPsim. Initially, the high ADP availability stimulates ATP synthase activity. This results in more proton flow through the ATP synthase back into the matrix, increasing ATP levels and decreasing DPsim. A lower DPsim enables the ETC to pump more protons easily. This draws electrons faster down the chain to oxygen, preventing electron accumulation in the ETC complexes, leading to relatively low ROS generation, as shown in the upper panel of Figure 6. Some of the glucose is also used to replenish glycogen stores, which requires ATP, making more ADP available for the ATP synthase.
But when glycogen stores and other anabolic processes are replenished and glucose is still fueling the ETC, ADP levels fall and ATP levels rise. Low levels of ADP decrease ATP synthase activity. There is less proton flow back into the matrix, and DPsim rises, while ETC flow slows down. The respiratory complexes accumulate electrons, increasing mitochondrial ROS generation.
In summary, electron flow down the ETC is relatively fast at first, and the production of ROS is relatively modest, as depicted in the upper panel of Figure 6. As the cell becomes more ATP-replete, DPsim rises, making it relatively harder to pump protons, and the ETC slows down, leading to higher levels of ROS, as shown in the lower panel of Figure 6.
Let’s look at this from a ROS signaling perspective.
Insulin generates a small burst of ROS, activating the insulin signaling cascade. Low levels of mitochondrial ROS can also facilitate the activation of insulin signaling. They can enhance insulin signaling in the same way as insulin binding to its receptor can: by inhibiting phosphatases that negatively regulate it, including PTP1B, and PTEN, as shown in Figure 7 below.
To get teleological:
- Insulin-derived ROS opens the floodgates and says to the mitochondria in the cell, “I hope you’re hungry.”
- Low levels of mitochondrial-generated ROS are the mitochondria’s way of saying, “Yep, keep it coming.” This is cellular insulin sensitivity or hunger.
When the cell becomes ATP-replete, ADP and DPsim rise, leading to a marked rise in mitochondrial-generated ROS production. This level of ROS shuts down insulin signaling (Figure 8).
The high levels of mitochondrial-generated ROS translate to, “No more, I’m full.” This is cellular insulin resistance or satiety.
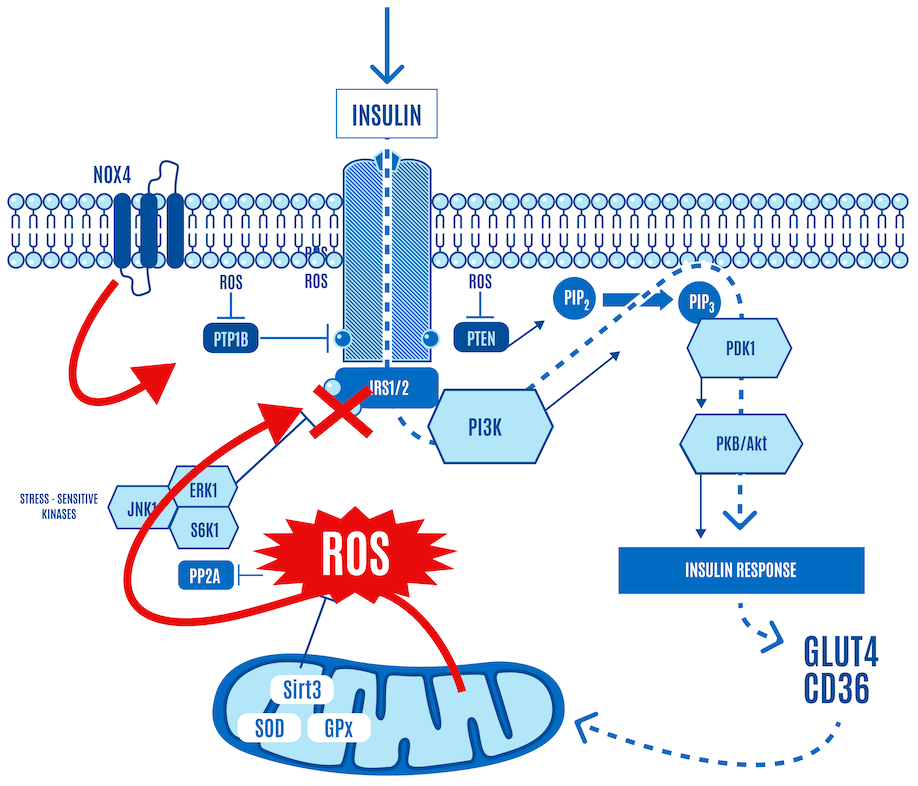
The whole insulin cascade stops functioning at this point because the cell is ATP-replete. The cell just had its meal and filled up on ATP. When it is full, it indicates this via a ROS signal, thereby shutting down insulin signaling.
- Insulin sensitivity and insulin resistance in miniature.
- Hunger and satiety at the cellular level, respectively.
As part of this shutting-down process, the phosphorylation level of AKT cannot be increased, no matter how much insulin is applied (Figure 9).
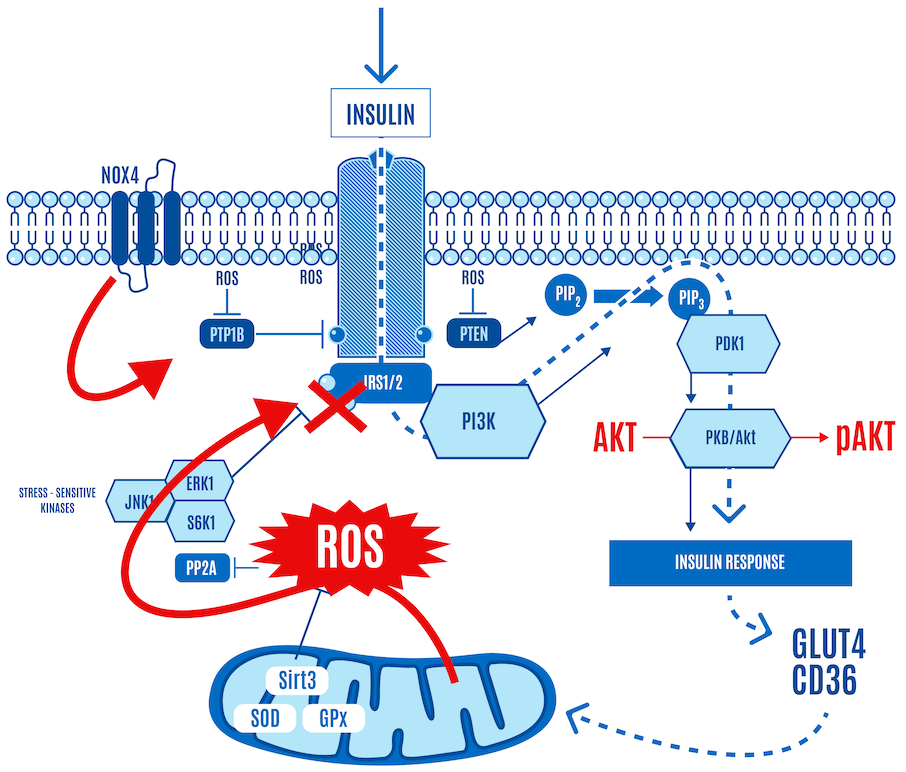
This is normal physiology in response to a carb-containing meal. AKT phosphorylation, a key step in insulin signaling activation, only occurs when ROS levels stay within certain limits.
It’s a negative feedback loop: insulin stimulates a little ROS at the cell membrane, glucose enters and is consumed by the mitochondria. When the mitochondria have had enough, they say so by communicating via a ROS signal that shuts down or severely limits glucose ingress. A small burst of insulin-generated ROS opens the cell’s floodgates, and a larger burst of DPsim-generated ROS closes them. The higher levels of ROS inhibit insulin signaling and effectively block the ingress of any more glucose into the cell. This protects the cell from an excessively high DPsim because if it were to continue rising, the levels of ROS generated would be so high that they would cause damage to the cell.
To summarize, insulin signaling is ROS-dependent. The mitochondria effectively integrate the cell’s total energy status. Thus, ROS generation serves as a physiological messenger that controls insulin signaling, while insulin regulates nutrient influx.
- Insulin is central to managing nutrients and controls lipid storage in adipocytes
- ROS generation controls insulin signaling:
- Low concentrations activate insulin signaling. This can be translated as “insulin sensitivity” or “cell hunger.”
- High concentrations inhibit insulin signaling: “insulin resistance” or “cell satiety.”
For the last several decades, the field has referred to ROS’s dual role as enhancers and inhibitors of insulin action as an unresolved paradox. From the point of view of the ROS hypothesis, the only paradox is how the dual role of ROS can be viewed as paradoxical.
Further reading and resources:
- Dobromylskyj, 2023 | Metformin (15) ROS
- Hoehn et al., 2009 | Insulin resistance is a cellular antioxidant defense mechanism
- Besse-Patin et al., 2014 | An Intimate Relationship between ROS and Insulin Signalling: Implications for Antioxidant Treatment of Fatty Liver Disease
- Goldstein et al., 2005 | Redox Paradox: Insulin Action Is Facilitated by Insulin-Stimulated Reactive Oxygen Species With Multiple Potential Signaling Targets
- Gallero et al., 2024 | Unresolved questions in the regulation of skeletal muscle insulin action by reactive oxygen species
Mitochondrial ROS generation
This overview explains how mitochondria generate ATP through oxidative phosphorylation (OXPHOS), and how reactive oxygen species (ROS), produced during this process, serve as both metabolic signals and act as brakes on insulin signaling, thus dictating nutrient intake. Rather than describing food in terms of “calories,” this model emphasizes the biochemical transformation of nutrients—carbohydrates, proteins, and fats—into high-energy electrons carried by NADH and FADH2, which are funneled into the mitochondrial ETC. There are two major mechanisms for generating mitochondrial ROS, DPsim-generated and beta-oxidation-generated ROS.
DPsim-generated ROS: a brief overview of OXPHOS
A note of clarification: You may notice that the word “calories” is not used to describe any of the following. That’s because we don’t consume calories, nor do we have calorie receptors; we consume food that can be converted into chemical energy, or ATP.
How do we turn food into energy? We convert carbohydrates, proteins, and fats into high-energy electrons, which are used to produce ATP, the primary energy currency of life. Most foods consist of carbon atoms bonded to hydrogen. We release the energy stored as high-energy electrons by removing the hydrogen atoms. A couple of carrier molecules called FADH2 and NADH pick up, transport, and drop off these electrons at different sites along the ETC.
In the simplistic world of the electron transport chain, the ETC consists of five protein complexes (I-V) and the CoQ couple, which acts as a central hub. These complexes and the CoQ couple are arranged along an inner membrane, with space on both sides. The matrix on the “inside” is the intermembrane space, the space between the inner and outer membranes. This is all represented in Figure 10 below.
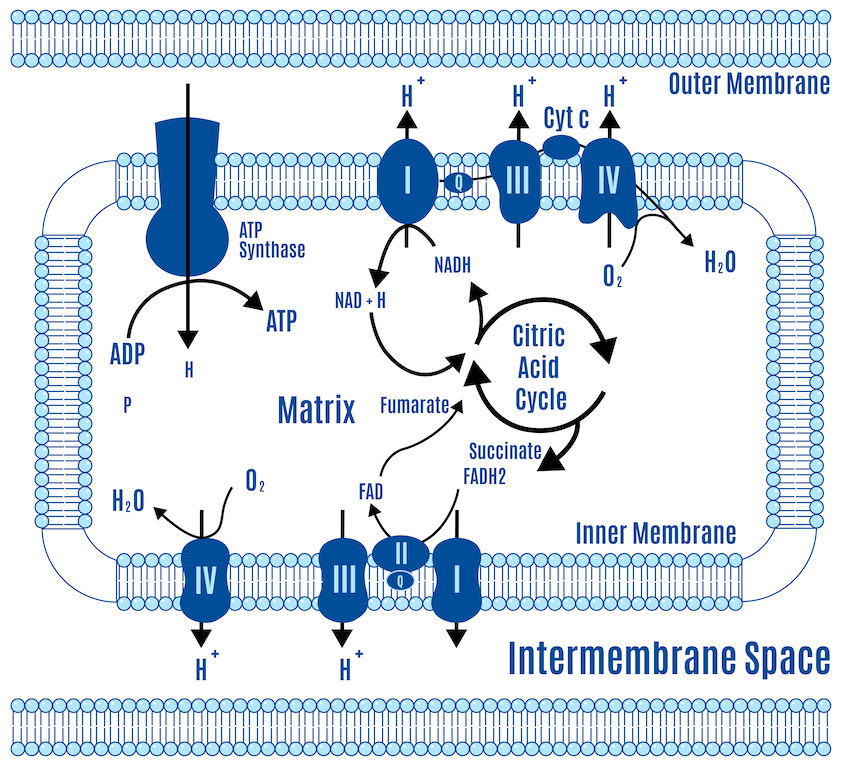
NADH is produced by glycolysis, the Krebs cycle, and beta-oxidation. There’s only one pickup station on the ETC for NADH: Complex I.
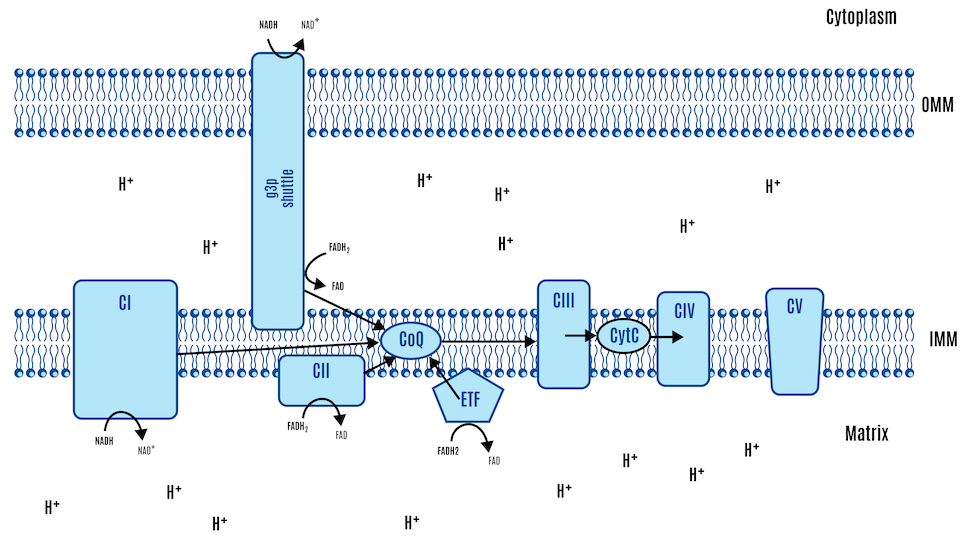
There are several inputs for FADH2. Complex II is the only one typically represented in standard textbook figures, such as the one above. However, there are several inputs for FADH2, and a couple of them are relevant to the ROS hypothesis of obesity. We’ll just use their abbreviations: mtG3Pdh (involved in glycolysis) and ETF (involved in beta-oxidation). All these electron-capturing structures along the ETC converge onto our central hub, CoQ, as depicted in Figure 11 below. All roads lead to Q.
In other words, these structures feed their electrons into the CoQ couple. From there, the electrons are handed off a lot like a bucket brigade:
CoQ → Complex III → Cytochrome c → Complex IV → oxygen → H2O
As the electrons are passed off, a little energy is released, which powers hydrogen ions called protons, or H+, pumping across the membrane.
As more nutrients are processed, electrons enter the ETC, increasing proton pumping across the membrane. The accumulation of protons on one side builds pressure on that side. This gradient isn’t pressure in the conventional sense but a combination of chemical and electrical forces called an electrochemical gradient (DPsim).
A force tries to equalize pressure when uneven across a membrane. The uneven distribution of protons across the membrane creates a force that tries to equalize this imbalance. This is similar to how reservoirs in hydroelectric dams store water at a height, creating potential energy. In the same way, the proton gradient across the mitochondrial membrane creates a potential energy that can be harnessed. This energy is harnessed by the ATP synthase, also known as Complex V, which acts like a turbine; as protons flow through, they drive the turbine, facilitating the production of ATP from ADP by adding a phosphate group.
Further reading and resources:
- Khan Academy | Oxidative phosphorylation
- Wikipedia | Electron transport chain
- Arnold and Finley, 2023 | Regulation and function of the mammalian tricarboxylic acid cycle
- Ninja Nerd, 2017 (YouTube) | Electron Transport Chain | Overview | Part 1 | Part 2 | Part 3
- Andrey K, 2015 (YouTube) | Electron Transport Chain | Introduction | Complex I and II | Q-Cycle and Complex III | Complex IV | Complex V
DPsim-generated ROS
At a simplified level, electrons from Complex I, Complex II, and ETFdh converge onto coenzyme Q (CoQ). When CoQ receives electrons, it is reduced to CoQH2. CoQH2 passes these electrons via Complex III and Complex IV to molecular oxygen. In the process, protons are pumped from the mitochondrial matrix into the intermembrane space to generate an electrochemical gradient or membrane voltage difference across the inner mitochondrial membrane (ΔΨm or DPsim). ATP is continuously broken down into ADP, and like a rechargeable battery, ADP is continuously regenerated into ATP. The vast majority of this ATP is produced in the ETC of the mitochondria. Protons flow back into the matrix through a complex called ATP synthase (Complex V), where ADP is turned into ATP.
Figure 12 provides a general pattern of bioenergetic states from severe energy stress at one end of the spectrum and the well-fed state at the other. During the postabsorptive phase (i.e., fasting), there can be relatively low levels of mitochondrial ATP to ADP, DPsim, and ROS. Figure 12 is somewhat exaggerated for effect, but it gives a general sense of the typical patterns.
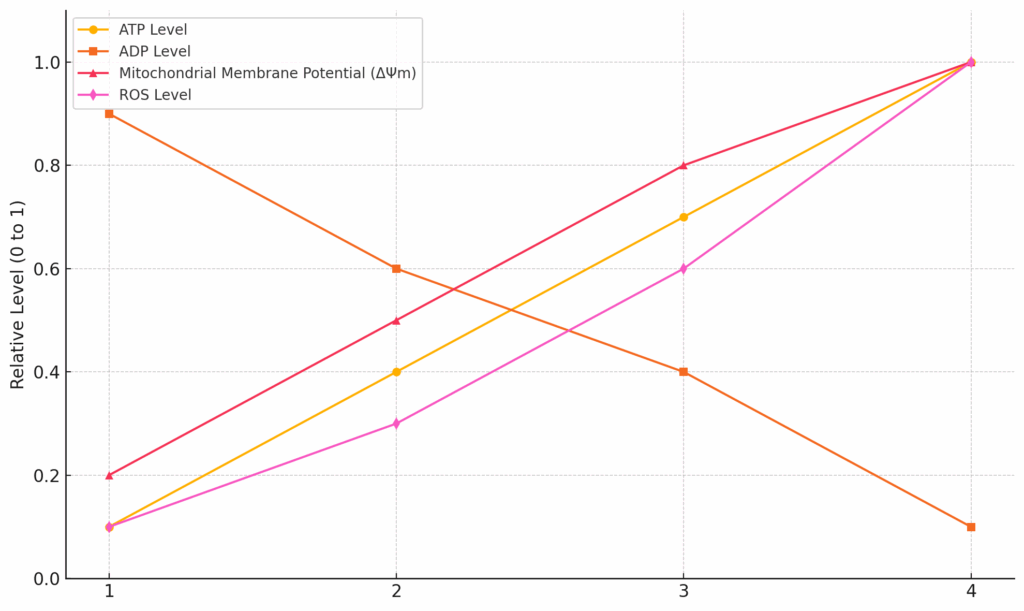
Now, let’s examine the situation where we’ve eaten a high-carb meal, and insulin is signaling and facilitating the entry of a load of nutrients into the cell (Figure 5). The mitochondria utilize these nutrients. Electron flow down the ETC is relatively fast, and the energy released along each step of the chain is coupled to the pumping of protons across the membrane (Figure 6, upper panel). This leads to a difference in proton concentration across the membrane: more protons in the intermembrane space compared to the matrix. In other words, DPsim rises. This increasing reservoir of protons acts as a reservoir of potential energy: the protons flow back into the matrix and power the ATP synthase, regenerating ADP into ATP. This process dissipates the proton gradient, but the flow of electrons and the pumping of protons by the ETC are faster than the rate at which ATP synthase uses the gradient. Low levels of ATP activate ATP synthase activity while high levels are inhibitory, acting as a feedback mechanism.
So, as the ATP to ADP ratio increases, the rate of ATP synthesis slows down. Less ATP synthesis means less dissipation of protons, the DPsim rises, and electron flow becomes more sluggish. The respiratory complexes accumulate electrons, increasing ROS generation. Overall, we observe an increase in ATP to ADP and DPsim, resulting in relatively high levels of mitochondrial ROS production (Figure 6, lower panel). This process is effectively a physiological form of insulin resistance. The higher levels of ROS inhibit insulin signaling and effectively block the ingress of any more glucose into the cell. They are protecting the cell from an excessively high DPsim because if it continues to rise, the levels of ROS generated would be so high that it would do damage to the cell.
It’s a negative feedback loop: insulin stimulates a little ROS at the cell membrane, glucose enters and is consumed by the mitochondria. When the mitochondria have had enough, they say so by communicating via a ROS signal that shuts down or severely limits glucose ingress. A small burst of insulin-generated ROS opens the cell’s floodgates, and a larger burst of DPsim-generated ROS closes them.
Beta-oxidation-generated ROS: a brief overview of beta-oxidation
Your body processes food through different pathways. At the mitochondrial level, a molecule of glucose winds up as a couple of pyruvate molecules that are converted into acetyl-CoAs and enter the Krebs cycle. Fats undergo beta-oxidation, breaking down into two-carbon units at a time before they enter the Krebs cycle as acetyl-CoA molecules. Both processes strip high-energy electrons from nutrients, attaching them to carrier molecules such as NADH or FADH2 for transport to the ETC.
The Krebs cycle produces three NADH and one FADH2 for each turn.
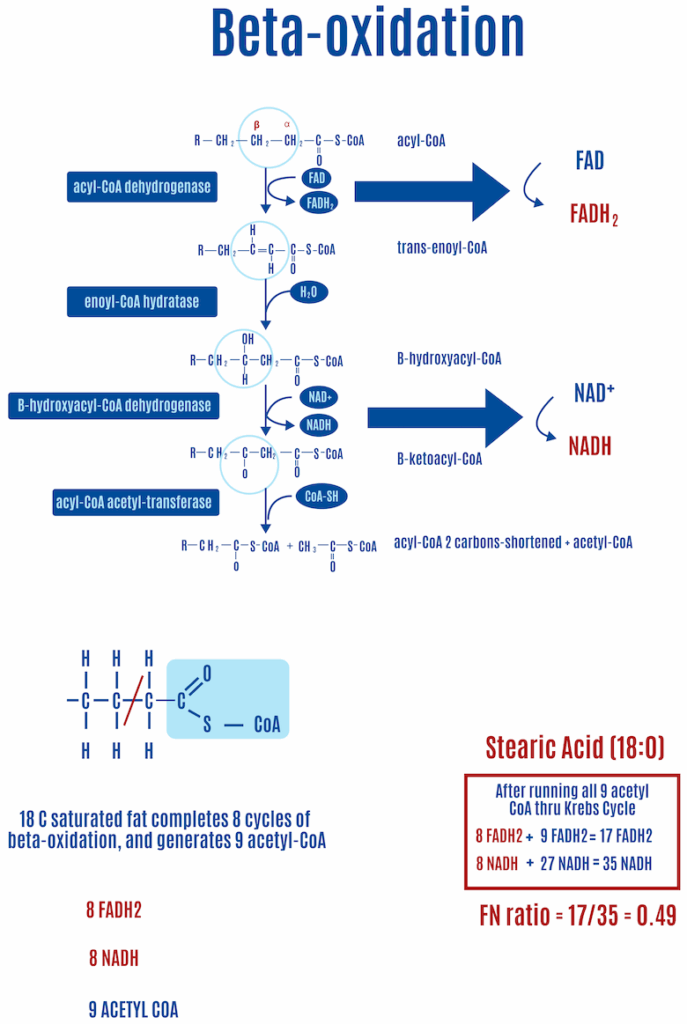
Beta-oxidation of fats, the process of chopping two-carbon segments of fat off at a time, consists of four steps.
For saturated fats such as stearic acid (18:0, where the number on the left of the colon represents the number of carbons and the number on the right is the number of double bonds), in each round of beta-oxidation the first step of beta-oxidation creates a double bond, releasing an electron that FADH2 captures. During the third step, another electron is released, and an NADH captures it this time, as shown in Figure 13. For every round of beta-oxidation, one FADH2 and one NADH are generated in addition to the ones generated in the Krebs cycle.
The first step of beta-oxidation is most relevant here because it is central to the ROS hypothesis of obesity. The amount of FADH2 generated during beta-oxidation varies with the saturation of fats: unsaturated fats generate less FADH2 due to fewer electrons being released in the first step. Why? Because the first step involves inserting a double bond into saturated fats, which releases an electron captured by FADH2; unsaturated fats already have one or more double bonds, so they “miss” the first step, and therefore, no electron is released and captured by FADH2, as depicted by the red “X” in Figure 14.1 The “mono” in monounsaturated fats means that it has one double bond. The “poly” in polyunsaturated fats indicates they have more than one double bond. Saturated fats are described as fully saturated with hydrogens and contain no double bonds, they only contain single carbon-carbon bonds.

Each double bond in an unsaturated fat results in one less FADH2 produced than a saturated fat of equal length. In the case of oleic acid (18:1) in Figure 14, a monounsaturated fat, there’s one double bond and therefore one less FADH2 compared with a saturated fat of equal length, which happens to be stearic acid (18:0), shown in Figure. If we look at linoleic acid (18:2), which has two double bonds and is shown in Figure 15, there are two fewer FADH2 molecules produced than with stearic acid.
As we’ll explore in a moment, this variation in FADH2 production plays a crucial role in determining how much fat is stored in fat cells according to the ROS hypothesis of obesity.
Further reading and resources:
- Ninja Nerd, 2017 (YouTube) | Fatty Acid Oxidation | Part 1 | Part 2
- Andrey K, 2017 (YouTube) | Oxidation of Fatty Acids | Oxidation of Unsaturated Fatty Acids
Beta-oxidation-generated ROS
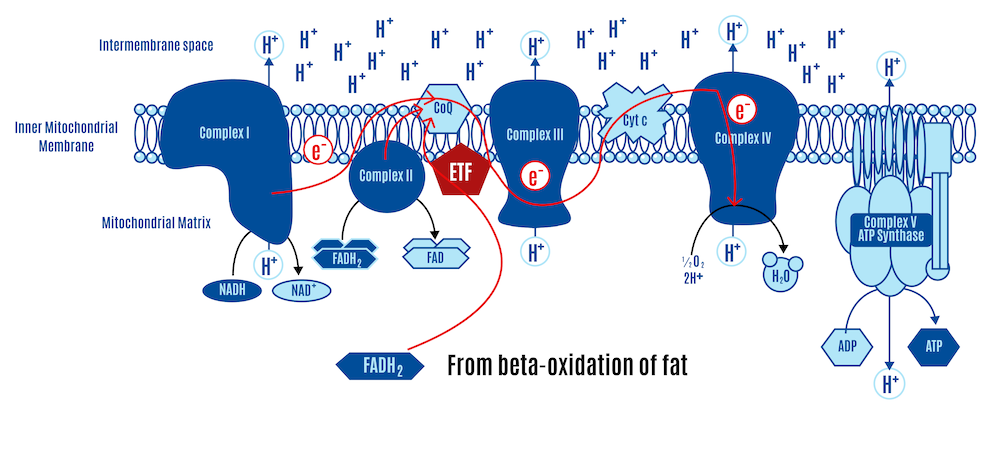
Picking up from the previous section, both the NADH from the third step of beta-oxidation and the NADH produced in the Krebs cycle are input into Complex I of the ETC. FADH2 enters the ETC through two pathways: the Krebs cycle via Complex II and from beta-oxidation via the ETF (Electron Transfer Flavoprotein and its dehydrogenase), as shown in Figure 16 below.
Recall that all roads lead to Q: electrons from Complex I, Complex II, and ETF converge at the CoQ couple, then pass through Complex III and Complex IV, which pump protons (H+) across the membrane, driving ATP production by Complex V (ATP synthase).
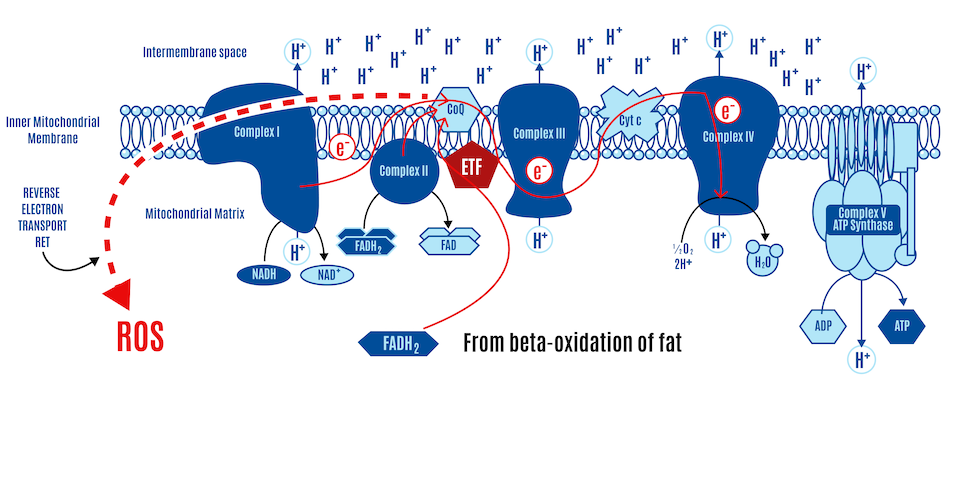
If most CoQ is present in its reduced form as CoQH2, there is no location to accept electrons. CII and ETFdh will attempt to place electrons onto the CoQ couple in competition with CI. Given a high membrane voltage, electrons from FADH2 can be transported in reverse through CI. This can lead to high physiological levels of ROS, which limit insulin signaling and, consequently, nutrient ingress into the cell.
Congestion in electron flow at the CoQ couple, not unlike a traffic jam, can lead to reverse electron transport (RET), where electrons flow backward through Complex I, producing ROS (Figure 17). These ROS signals cellular fullness, which makes reasonable sense since, in this scenario, it typically means the ETC is filled with electrons, the membrane potential is high, and the ATP-to-ADP ratio is high (more ATP-replete). The ROS signals their fullness by inhibiting insulin signaling, which effectively blocks the uptake of nutrients into the cell.
Fatty acid oxidation (i.e., beta-oxidation of fat) leads to the generation of ROS through RET, and it is the ratio of FADH2 to NADH (FN ratio) inputting into the ETC that controls RET. Since fatty acids, through the process of beta-oxidation, produce a high FN ratio, they intrinsically generate ROS. Whenever a cell is oxidizing fatty acids, it generates a ROS signal.
- A fully saturated fatty acid of C18 length — stearic acid (18:0) — generates an FN ratio of approximately 0.49 (Figure 12).
- Adding one double bond to a C18 fatty acid gives oleic acid (18:1) and reduces the FN ratio to 0.46 (Figure 13).
- Adding two double bonds reflects linoleic acid (18:2) and reduces the FN ratio to 0.43 (Figure 14).
- Glucose generates an FN ratio of 0.2.
The generation of ROS to limit insulin signaling and subsequent nutrient ingress — and storage as triglyceride — is limited in proportion to the fall in FADH2:NADH ratio with extra double bonds. More FADH2 during beta-oxidation, driven by saturated fat metabolism, means more electrons at the CoQ couple, increasing RET and subsequent ROS production. This enhances localized insulin resistance and limits nutrient ingress, a form of cellular satiety (Figure 18).
While the details are beyond the scope of this primer, the FN ratio for glucose (0.2) rises with the activation of the G3P shuttle (FIgure 18). In the G3P shuttle, cytoplasmic NADH generated from glycolysis donates its electrons to dihydroxyacetone phosphate (DHAP), reducing it to glycerol-3-phosphate. G3P then transfers these electrons to FAD, which is embedded in the inner mitochondrial membrane via mitochondrial glycerol-3-phosphate dehydrogenase (mtG3Pdh), forming FADH2. This FADH2 delivers electrons directly to the ETC to CoQ.

Conversely, PUFAs like linoleic acid generate a lower FN ratio and are therefore relatively poor at producing beta-oxidation-generated ROS to inhibit insulin signaling and the ingress of nutrients into the cell. Instead, more DPsim-generated ROS is required to compensate for the lack of ROS coming from beta-oxidation to inhibit the insulin signaling cascade. The DPsim-generated ROS signal is designed to combine with the cross signal coming from beta-oxidation-generated ROS during a mixed meal, but it’s not happening because PUFAs aren’t very good at generating ROS. We have continued to facilitate the entry of nutrients into the cell to generate more ATP and diverted nutrients into lipid droplets for storage when the cell is already energy replete. If PUFAs like linoleic acid are disproportionately consumed in high quantities, we have an ongoing issue with inappropriate lipid droplet expansion (i.e., obesity).
Thus, a major implication of the ROS hypothesis of obesity is that increased consumption of PUFAs, such as linoleic acid, can promote an inappropriate loss of nutrients into fat storage, which manifests over time as excess fat accumulation.
Further reading and resources:
- Speijer, 2016 | Being right on Q: shaping eukaryotic evolution
- Dobromylskyj, 2021 | Protons (53) a formula revised
- Dobromylskyj, 2020 | Protons (53) a formula
Key points
ROS and insulin
- Insulin is central to managing nutrients and controls lipid storage in adipocytes.
- ROS generation controls insulin signaling.
- Insulin signaling is ROS-dependent.
- Low concentrations activate insulin signaling (insulin sensitivity).
- High concentrations inhibit insulin signaling (insulin resistance).
DPsim-generated ROS
- When the DPsim rises significantly — which often occurs in the well-fed (i.e., ATP replete) state — electron flow slows, and ROS production increases.
- This DPsim-generated mitochondrial ROS, when it reaches a certain level, acts as a feedback signal to dampen insulin signaling and limit further nutrient uptake, helping to prevent both ROS and nutrient overload.
Beta-oxidation-generated ROS
- The amount of FADH2 to NADH (FN ratio) produced varies. Saturated fats generate a higher FN ratio than unsaturated fats due to differences in the presence of double bonds.
- A higher FN ratio can lead to reverse electron transport (RET), which produces ROS. Beta-oxidation of PUFAs generates a lower FN ratio, reducing the likelihood or amount of RET and subsequent ROS production.
- A higher FN ratio produces more ROS, thereby enhancing localized insulin resistance and limiting further nutrient ingress.
Saturated fats generate ROS better than PUFAs.
The ROS hypothesis of obesity
- Mitochondrial ROS act as key metabolic regulators, turning nutrient load into a signal that modulates insulin sensitivity. ROS balance is shaped by nutrient type and composition, energy status, and mitochondrial dynamics.
- PUFAs generate less FADH2 per NADH, produce less ROS, and are less effective at signaling cell fullness, allowing excess nutrient entry and fat storage.
Further reading and resources
Bob Kaplan is an independent research analyst. Bob previously served as director of research at Early Medical, contributing to The Drive podcast with Peter Attia and its other properties. Kaplan was a researcher at the Nutrition Science Initiative (NuSI), and an exercise physiologist at the University of Nevada, Las Vegas. His current and previous research interests include meta-research, chronic diseases, bioenergetics, exercise physiology, and nutrition.

Support the Broken Science Initiative.
Subscribe today →
One Comment
Leave A Comment
You must be logged in to post a comment.
recent posts
How a Low-Carb Ketogenic Diet Naturally Activates the Same Pathways


So if the influx of glucose into the cell is actually controlled by ROS at the root. Are there studies where reducing ROS in the body is seen to aid preventing weight gain for instance?