Contents
Introduction
Introductory note from Peter Dobromylskyj:
This presentation documents the initial core concepts of the ROS hypothesis of obesity. It has been simplified to an extreme degree. Over the years the hypothesis has been expanded to include the role of excessive insulin sensitivity in the inhibition of fat oxidation, the role of uncoupling by PUFA and pharmaceutical agents in the limitation of obesity and the role of basal lipolysis mediated lipid release in the generation of insulin resistance, with limitation of further adipose gain. The presentation here is the concept from which that extended exploratory journey began.
Annotation mainly includes transcription from Dr. Dobromylskyj’s presentation, edited for clarity.
Video
Peter Dobromylskyj: ROS signaling controls nutrient ingress into cells
Visit Peter’s blog, Hyperlipid
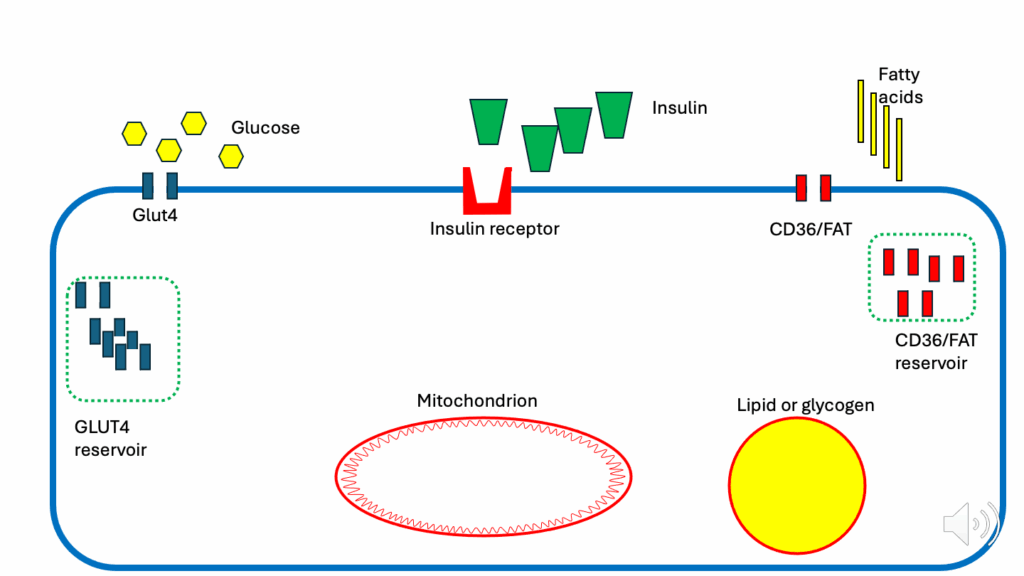
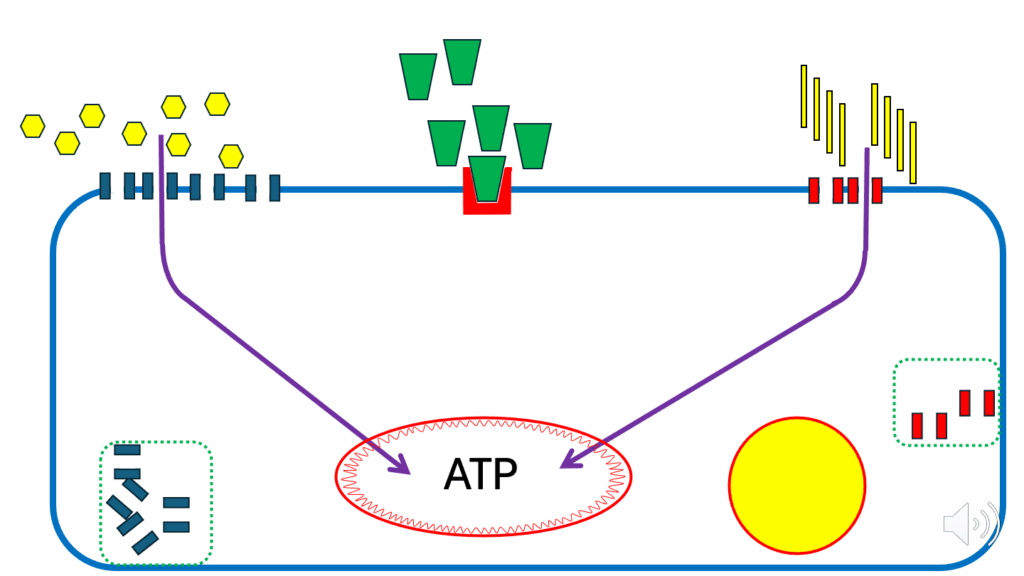
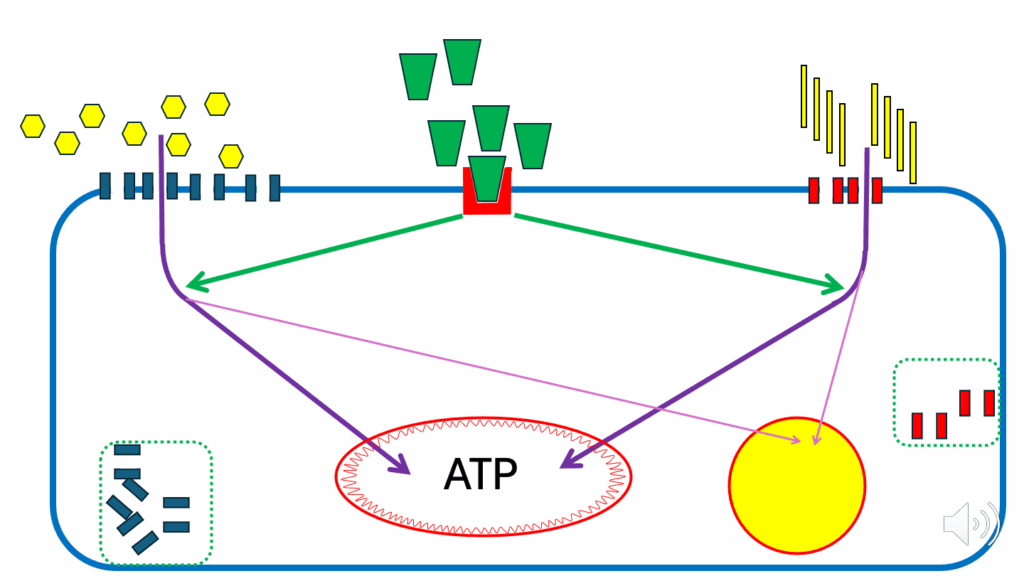
Figure legend
- Blue rounded rectangular border: an insulin-sensitive cell (e.g., myocyte, adipocyte)
- Green cones: insulin
- Red cone holder: insulin receptor
- Yellow hexagons: glucose
- Blue vertical rectangles: GLUT4s (glucose transporters; facilitate glucose entry into cell)
- Dotted green rectangle on left: GLUT4 reservoir (release is controlled by insulin signaling)
- Yellow vertical rectangles: fatty acids (FAs)
- Red vertical rectangles: CD36/FAT (FA transporters; facilitate FA entry into cell)
- Dotted green rectangle on right: CD36/FAT reservoir (release is controlled by insulin signaling)
- Red oval: mitochondrion
- Yellow circle with red border: nutrient storage compartment (e.g., lipid as TG, glucose as glycogen, ATP as ATP-PC)
Fasting metabolism
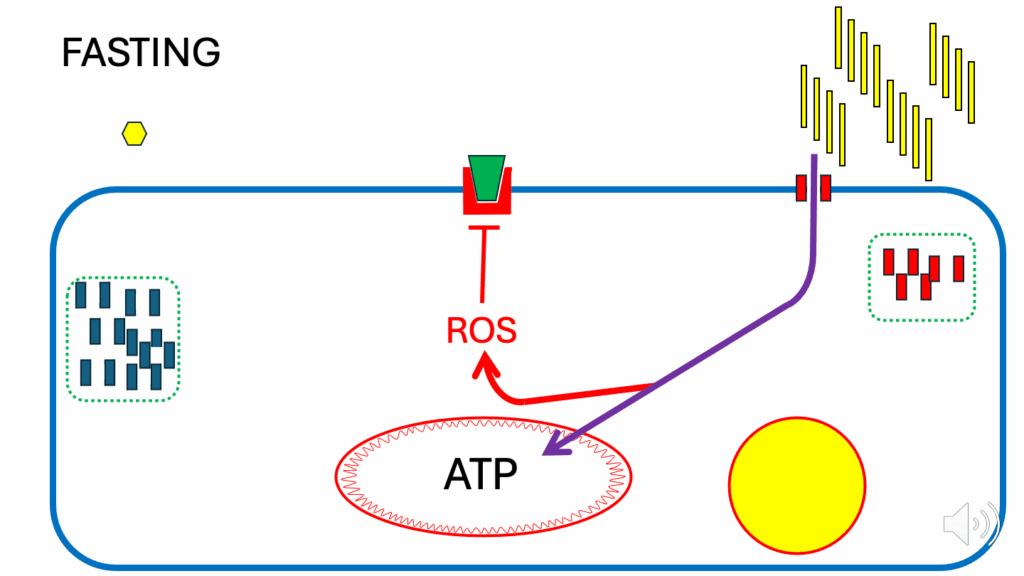
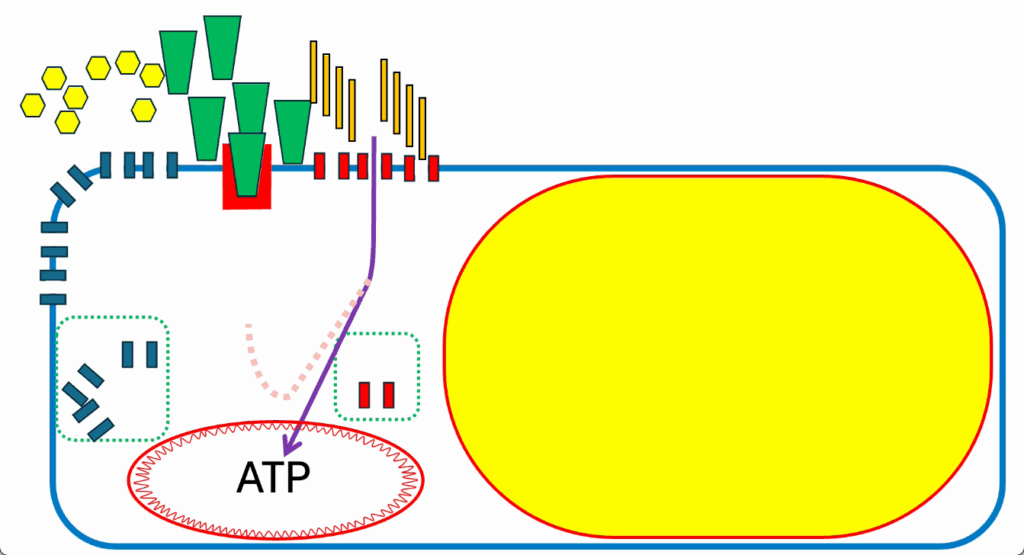
- Let’s look at the situation under fasting (Figure 2), a relatively simple situation.
- Under fasting conditions, glucose is low, insulin is low, and FFAs are high.
- Even with the minimal number of CD36 at the cell surface (low insulin), enough FFAs can enter the cell to provide all of the ATP that the cell needs.
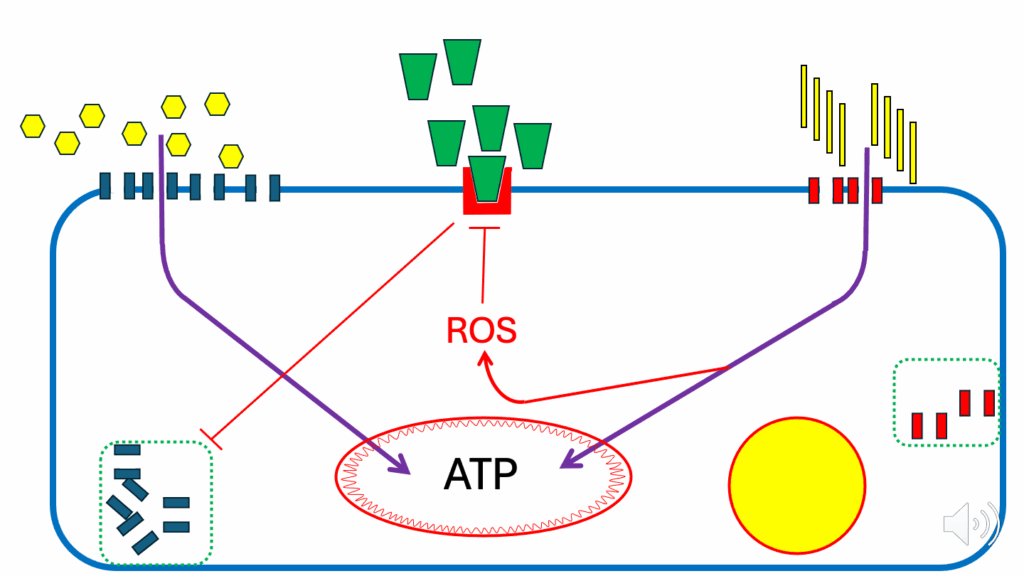
- There’s a specific feature of fatty acid oxidation (FAO), which leads to the generation of ROS. It’s intrinsic — some fatty acids do it slightly better than others, but whenever a cell is oxidizing fatty acids, it will be generating a ROS signal.
- The ROS under the fasting condition are produced in such quantities that they act as an inhibitory signal on the insulin signaling cascade.
- They do that so that if any insulin docks with its receptor, there is no signal to translocate GLUT4 to the cell membrane, and glucose can’t enter.
- This is a very long-term, highly conserved mechanism in which FAO inhibits insulin signaling during fasting to spare glucose for the brain.
Glucose-based metabolism
- Glucose-based metabolism — examples:
- A high-starch meal
- An oral glucose tolerance test (OGTT)
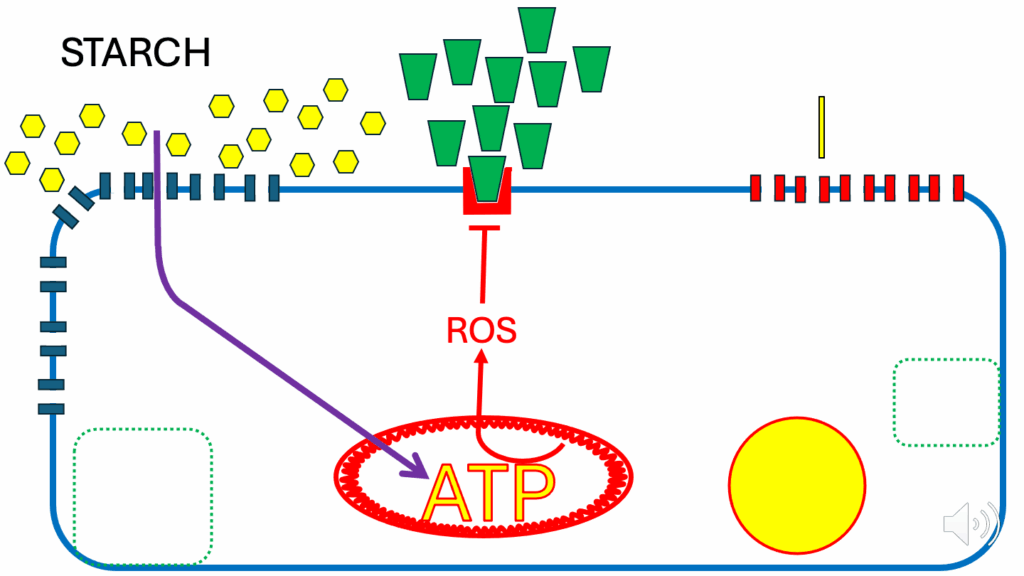
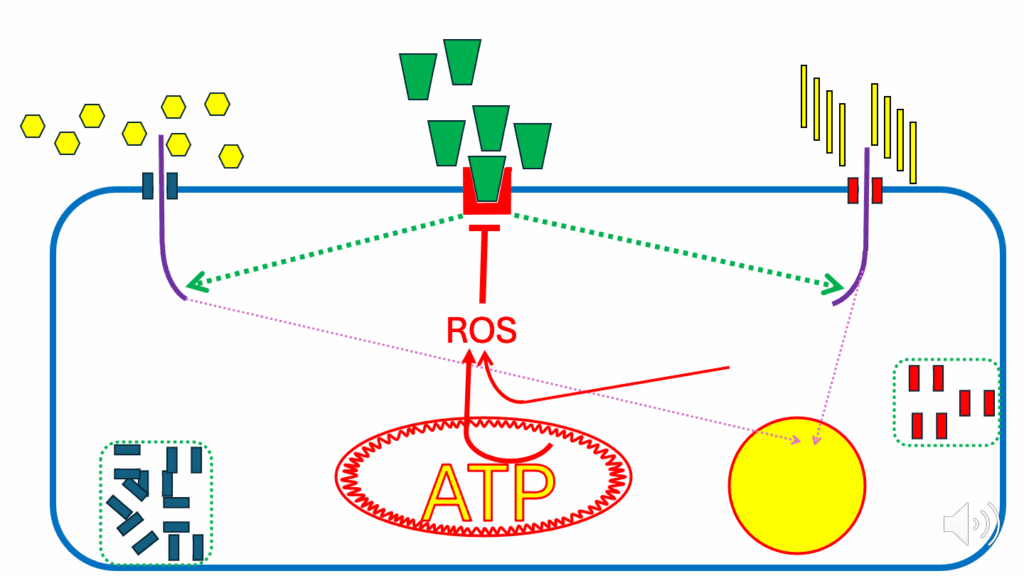
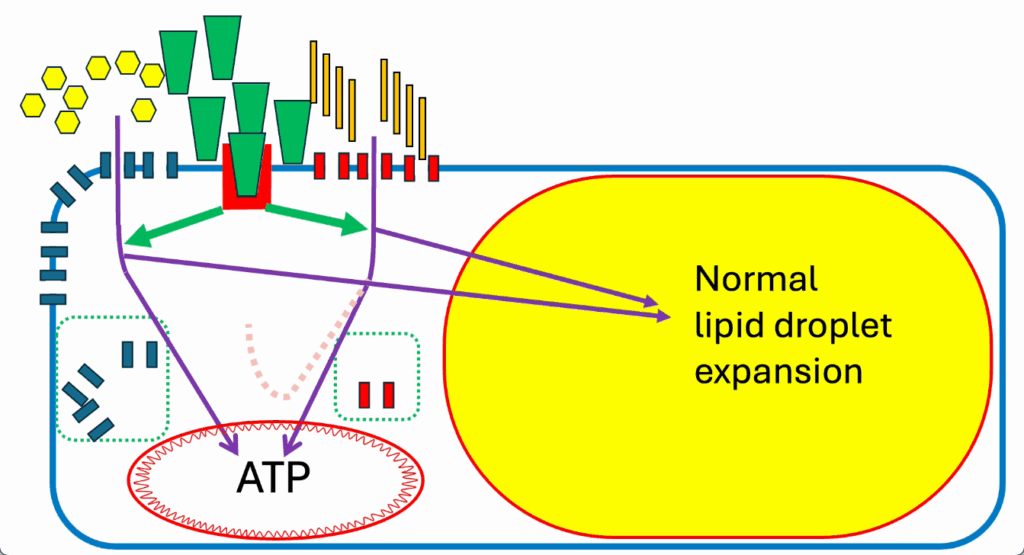
- In the high-starch meal, glucose is present in large amounts, insulin is present in large amounts, and FFAs are present in minimal amounts (Figure 3) — because insulin has acted at a distant site on adipocytes to suppress FFA release.
- There are FFAs present, but not very many of them.
- And insulin signals to the storage vesicles and GLUT4s are released — the GLUT4s set themselves up on the cell membrane and allow glucose to run through.
- Glycolysis and glucose derivatives are used to generate ATP.
- Glucose usually doesn’t generate any ROS.
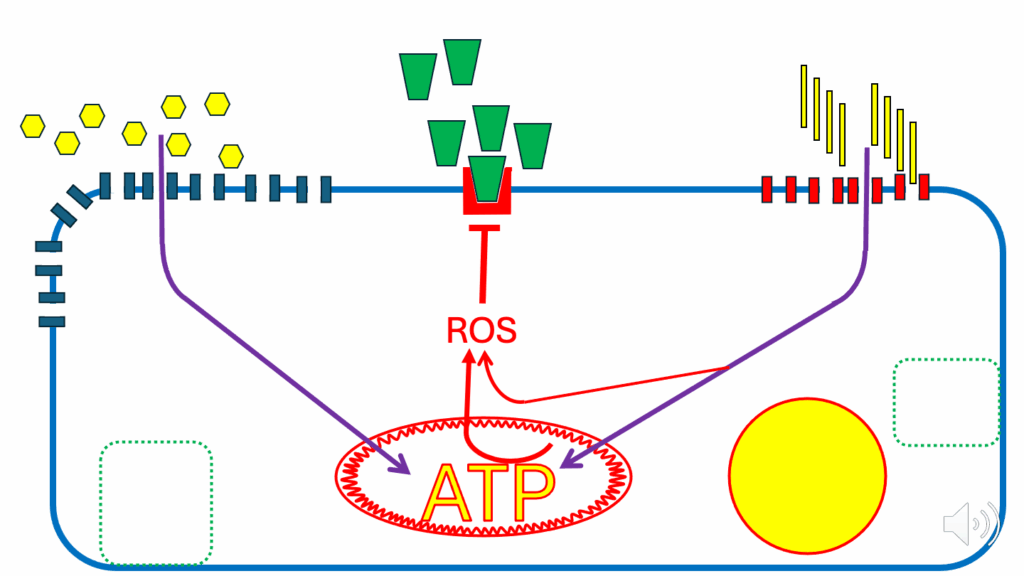
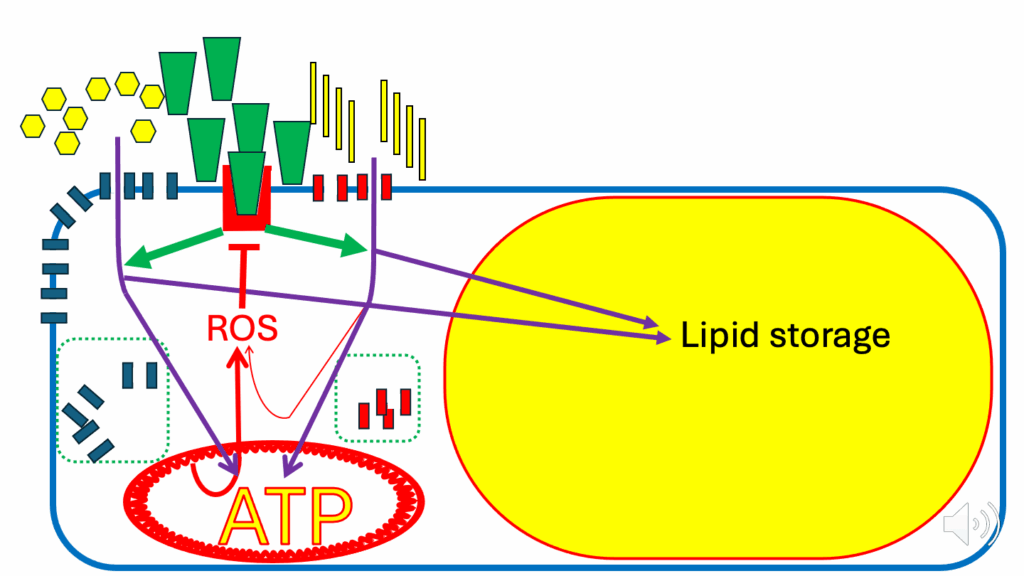
- There comes a point, after a certain amount of glycolysis has occurred, when the mitochondria within the cell consider themselves to be replete with ATP (Figure 4).
- When the mitochondria within the cell consider themselves to be replete with ATP (see ATP in larger yellow letters in Figure 4), the ATP synthase, which uses the proton gradient across the inner mitochondrial membrane to generate ATP, is inhibited.
- There’s a simple negative feedback: ATP itself inhibits ATP synthase.
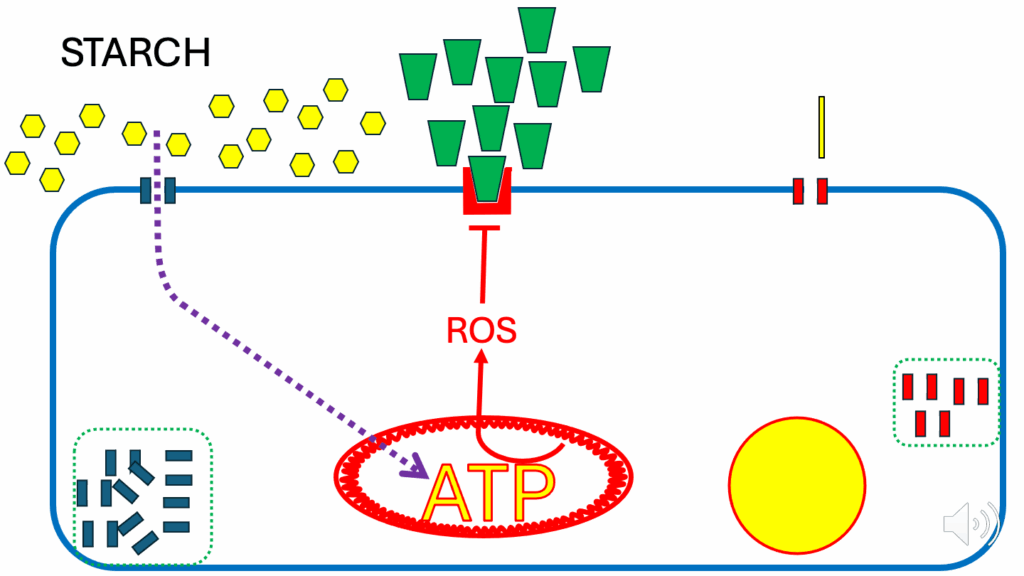
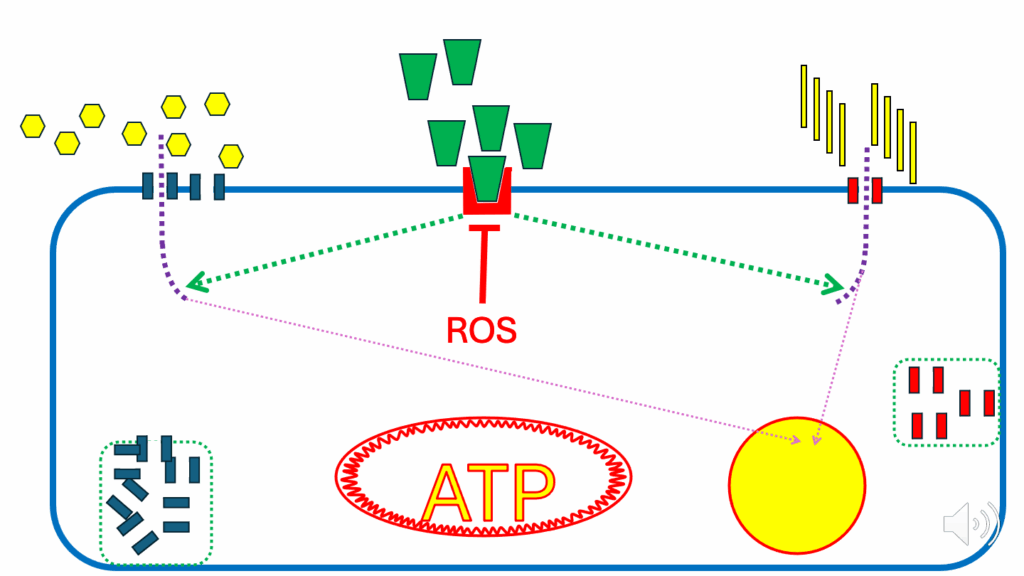
- When that happens, the mitochondrial inner membrane potential (DPsim) is not being used (i.e., dissipated by ATP synthase), and the membrane potential rises (see the thicker red squiggles encircling the mitochondrion in Figure 5).
- Once the potential gets to a certain level, it starts to generate ROS in its own right (see the red arrow to ROS from ATP & DPsim in the mitochondrion in Figure 5) — this DPsim-generated ROS is independent of FAO-generated ROS.
- These do not have to do with the ROS being produced by FAO — they’re from a different mechanism.
- The figure that’s generally cited is that above 170 millivolts (mV), ROS are produced in rapidly increasing amounts with progressively increasing DPsim.
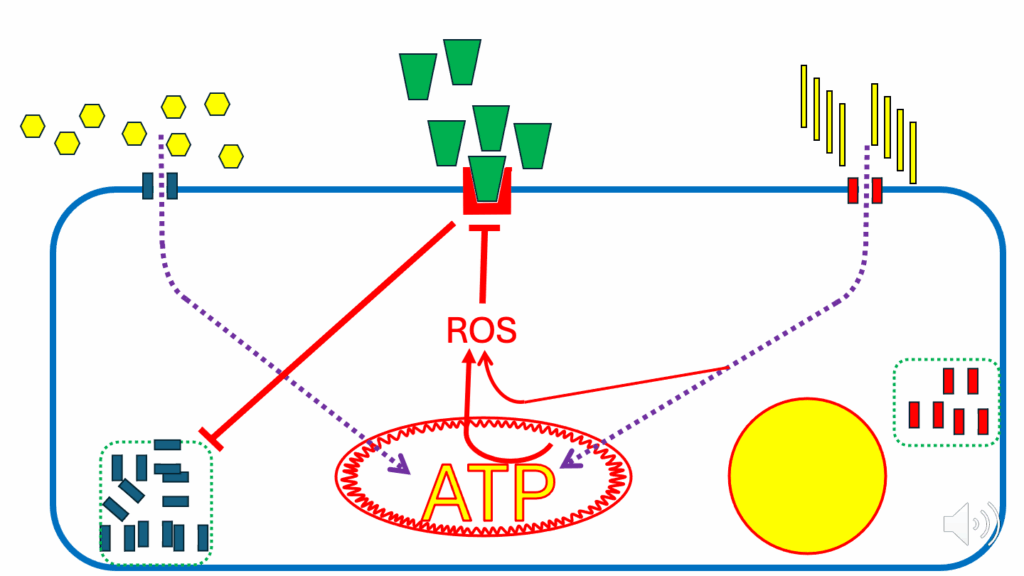
- These ROS, from a different source, also act to inhibit insulin signaling (see the red inhibition symbol at the insulin receptor from ROS and see the now dotted purple arrow indicating less glucose ingress into the cell and mitochondrion in Figure 6).
- This is an adaptive/physiological form of insulin resistance (like fasting)
- When these ROS (see the red arrow to ROS from ATP & DPsim in the mitochondrion in Figure 6) inhibit insulin signaling (see the red inhibition symbol at the insulin receptor from ROS in Figure 6), they severely limit the ingress of glucose into the cell (see dotted purple arrow indicated less glucose ingress into the cell and mitochondrion in Figure 6)
- And when they do that, they are protecting the cell from an excessively high DPsim, because if it were to continue to rise, there would be so much in the way of ROS generated that it would do damage to the cell.
- It’s again a negative feedback: glucose enters and is consumed by the mitochondria. When the mitochondria have had enough, they say so by communicating via a ROS signal that shuts down or severely limits glucose ingress.
- Insulin resistance is an antioxidant defense mechanism: it limits excessively high ROS generation, which can be cytotoxic.
Mixed-meal metabolism
- Let’s look at the aftermath of a mixed meal (i.e., mixed-meal metabolism) containing substantial amounts of both carbs and fat.
- Glucose is moderate (yellow hexagons in Figure 7), insulin is moderate (green cones in Figure 7), and FFAs (yellow vertical rectangles in Figure 7) are moderate.
- While the cell is not replete with ATP, it’s very easy to run ATP synthase, then glucose can be oxidized quite happily, and FFAs can be oxidized quite happily.
- During mixed-meal conditions, whenever there is a requirement for the cell to generate more ATP, all is fine.
- Though they’re not in any way generating as much ROS as they would have been under the fasting condition, FFAs are still going to generate a ROS signal in proportion to the amount of fatty acids that are being oxidized (see the arrow pointing to ROS from FAO in Figure 8).
- That FAO-generated ROS signal is going to inhibit the insulin signaling cascade partially.
- When that happens, there’s a partial suppression of the release of GLUT4s (see the inhibition arrow at the GLUT4 reservoir). So we don’t have as many GLUT4s being translocated to the cell surface membrane.
- And that’s done so that when fatty acids provide more fuel, the cell does not need as much fuel from glucose.
- It’s a balancing act: however much FFAs are generating ATP, their ROS signal reduces the glucose intake in proportion to the energy that FFAs are supplying.
- And the more fatty acids are being oxidized, the less glucose is allowed into the cell.
- And the signal for that is ROS.
- We get towards the cell-replete situation (see the larger ATP text).
- And the inner mitochondrial membrane potential rises because there’s enough ATP in the cell for that to happen (see the thicker red squiggles circling the mitochondrion). And it produces its own ROS signal: DPsim-generated ROS (see the arrow from ATP to ROS), which combines with the one from FAO (see the arrow from FAO to ROS) to give a solid inhibitory signal from ROS to the insulin signaling cascade.
- Both DPsim-derived ROS and FAO-derived ROS combine to give a solidly insulin-resisting signal.
- The inhibitory signal from ROS to the insulin signaling cascade, which inhibits GLUT4 translocation (see the inhibition symbol at the GLUT4 reservoir in Figure 10), and coincidentally inhibits CD36 translocation as well (see more of the CD36 back in its reservoir).
- That’s, again, the simple situation where the cell is energy replete, and a ROS signal combined from two sources, limits glucose and fatty acid ingress to levels that don’t damage the mitochondria by excessively high DPsim.
- Increased insulin resistance leads to glucose and fatty acid (FFA) transporters returning to their storage vesicles, limiting nutrient uptake into the cell.
Nutrient storage (during a mixed meal)
- Let’s look at nutrient storage during a mixed meal scenario (Figure 11).
- We haven’t said anything about nutrient storage up until now, because there would have been too many arrows on the diagram.
- This is while everything is going very easily, the cell is happy to produce ATP, and glucose and FFAs are entering the cell in balance (see the green arrows depicting insulin facilitating glucose and fatty acid ingress and thick purple arrows from glucose and fatty acids into the mitochondrion), as discussed in the previous section.
- While insulin signals, there is a diversion of a proportion of the fatty acids that enter the cell into storage (see the purple arrow from fatty acids into the storage site).
- At the same time, insulin signals to divert a proportion of the glucose from being oxidized to produce ATP into storage as well (see the purple arrow from glucose into the storage site).
- And that goes on continuously while it is easy for the cell to accept nutrients.
- Insulin signaling promotes not only nutrients → ATP, but also facilitates nutrients → cell storage.
- Next, we come to the situation where the mitochondria consider that there is adequate ATP being produced for the cell’s needs (see the larger ATP text in the mitochondrion in Figure 12).
- Don’t forget that there are still ROS being produced by fatty acids (see the red arrow to ROS from FAO).
- Those are combined with those from the inner mitochondrial membrane (see the red arrow from ATP in the mitochondrion) to inhibit insulin signaling (see the red inhibition symbol below the insulin receptor).
- So, when we inhibit insulin signaling for nutrient ingress (see the dotted green arrows depicting limited nutrient ingress due to inhibition of insulin signaling):
- It’s also going to inhibit the diversion of fatty acids to storage (see the dotted purple arrow from fatty acids into the storage site), and
- It’s also going to inhibit the diversion of glucose to storage (see the dotted purple arrow from glucose into the storage site), glycogen, or glycerol for TG formation.
- Since insulin signaling facilitates nutrients into cell storage, insulin resistance suppresses nutrient ingress into storage.
- The signal that controls this is still a ROS signal.
- What shuts down nutrient ingress (see dotted purple lines from glucose and FFAs in Figure 13) also shuts down nutrient storage (i.e., ROS).
- When the cell is “full” or ATP-replete, it signals to stop more nutrients from coming in, which limits nutrient storage.
Adipocytes (during a mixed meal)
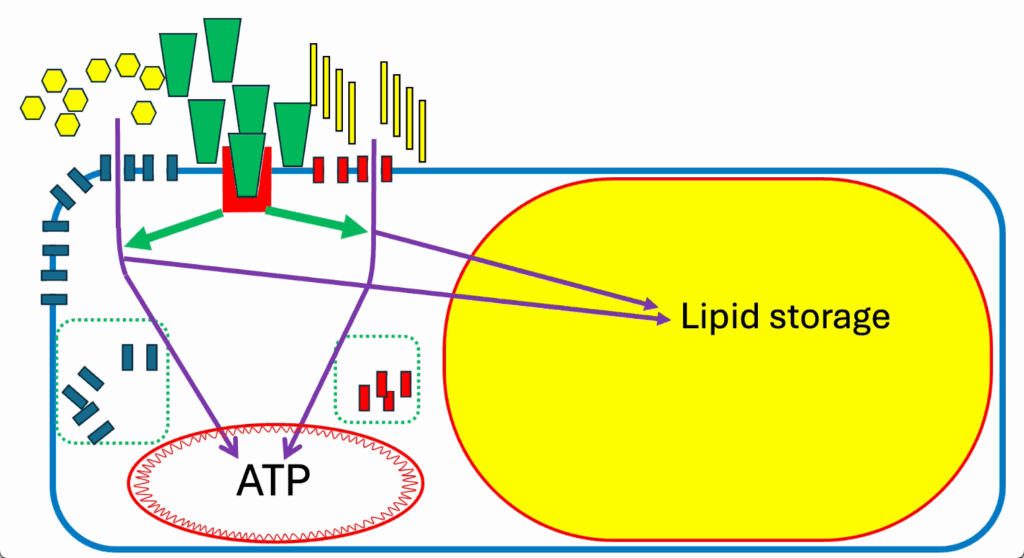
- Let’s consider adipocyte metabolism during a mixed meal (Figure 14).
- Here’s our adipocyte. Everything is moved over to the left in Figure 14 because the lipid storage droplet takes up most of the room.
- This is a mixed meal situation, again with glucose on the left and insulin at moderate levels in the middle, and FFAs at moderate levels on the right-hand side.
- Standard approach. Simple ATP generation. Everything’s happy. There’s no real complication to it.
- Insulin signals to divert both glucose and FFAs (thick green arrows pointing to glucose and fatty acid ingress) into lipid storage (purple arrows into the lipid droplet) (Figure 14).
- Don’t forget there’s still the ROS from FAO (see the thin red arrow pointing to ROS from FAO in Figure 15) going on. And that’s happening whatever the ATP status of the cell is.
- But as ATP becomes replete, the DPsim-generated ROS (see thick red arrow pointing to ROS from ATP in the mitochondrion), joined with the ROS from FAO, generates a much bigger ROS signal.
- You get a much bigger ROS signal, which inhibits insulin signaling.
- That inhibits all of the insulin signaling cascades (see the dotted green arrows and squares). Therefore, the signals to divert lipid and glucose into the adipocyte are inhibited.
- And we have a correctly sized adipocyte (Figure 16).
- The adipocyte behaves the same as any other cell except that its specialized function is the storage of lipid droplets, and it’s controlled in the same way by ROS.
- Insulin resistance limits nutrient ingress, which limits fat storage in the adipocyte, resulting in a correctly sized adipocyte.
Signaling failure (during a mixed meal)
- What happens when the signaling system goes awry?
- Note, the color of the FFAs that are being provided by this particular meal has changed (Figure 17) to imagine a very special fatty acid, which is perfectly good at being used to generate ATP (see thick purple arrow into ATP in the mitochondrion).
- But the little curved side arrow, which usually represents the generation of ROS in response to FAO, has lost its arrow on the end. It’s been marked in pale and has a dashed line.
- This is to make it evident that this particular fatty acid is not very good at generating a ROS signal. And that matters.
- So long as the cell is not ATP replete, it’s happy to make ATP, and this loss of negative feedback system or ROS generation system doesn’t matter (Figure 18).
- Lipid storage goes on perfectly well. Energy generation proceeds smoothly, and we approach a situation where we have a normal lipid droplet.
- It’s expanded to its normal size.
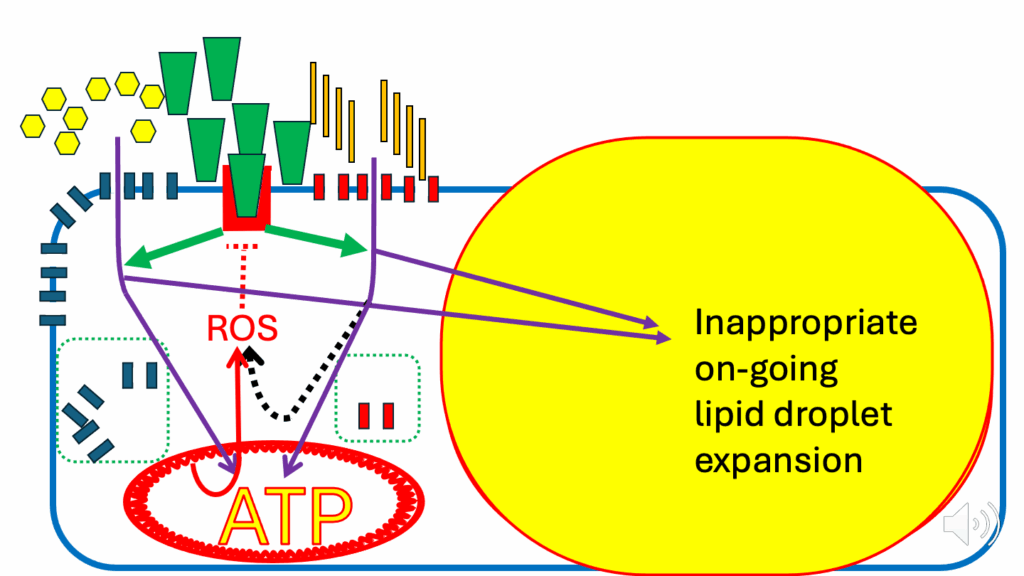
- The situation changes when we reach a nutrient-replete state (Figure 19).
- In the nutrient-replete state, ATP is high. The DPsim is not being consumed to generate ATP.
- So, the DPsim rises, and we generate a signal to stop any further ATP production. And that’s the DPsim-generated ROS signal.
- The DPsim-generated ROS signal is designed to combine with the cross signal coming from the FAO-generated ROS.
- But it’s not happening because this particular fatty acid is not very good at producing ROS. When that happens, we experience a failure of insulin signaling inhibition.
- Those ROS wanted to shut down insulin signaling, but it’s not a strong enough signal to do that.
- And we have continued entry of nutrients into the cell to generate more ATP, which the mitochondrial inner membrane doesn’t want.
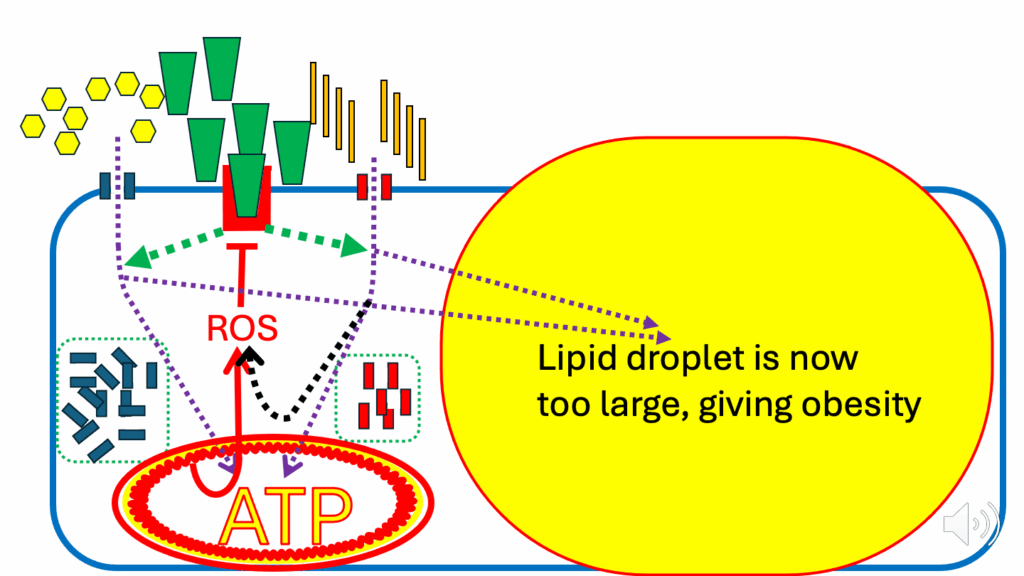
- We have continued diverting nutrients into lipid droplets for storage. Therefore, we have inappropriate ongoing lipid droplet expansion, on the way to obesity (Figure 19).
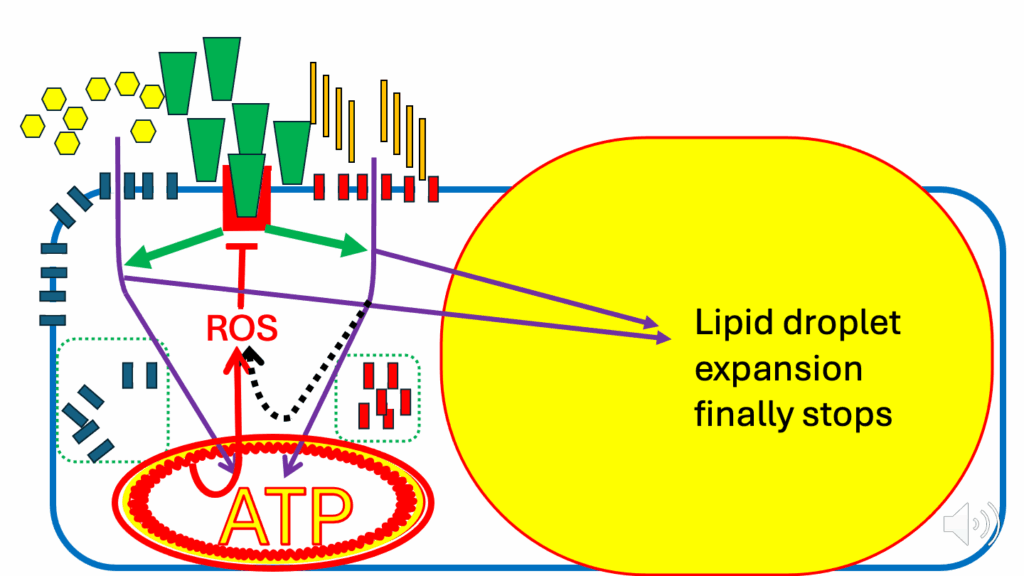
- Eventually, the ATP situation gets worse. There are still nutrients entering the cell when there really shouldn’t be, and the DPsim rises even further (see the thicker squiggles encircling the mitochondrion in Figure 20).
- When that happens, a much larger DPsim-generated ROS signal is produced.
- And that finally sets up solid inhibition of the insulin signaling cascade.
- And at that point, the lipid droplet stops getting any bigger.
- The whole insulin signaling cascade for lipid storage and ATP generation is inhibited.
- But, because we’ve been late in shutting down nutrient ingress and nutrient storage, the lipid droplets are now bigger, and that’s us on the route to obesity (Figure 21).
- The continuing ingress of nutrients eventually shuts down insulin signaling, but not before inappropriately enlarged adipocytes, which manifests as obesity (i.e., disorder of excess fat accumulation).
The ROS hypothesis of obesity
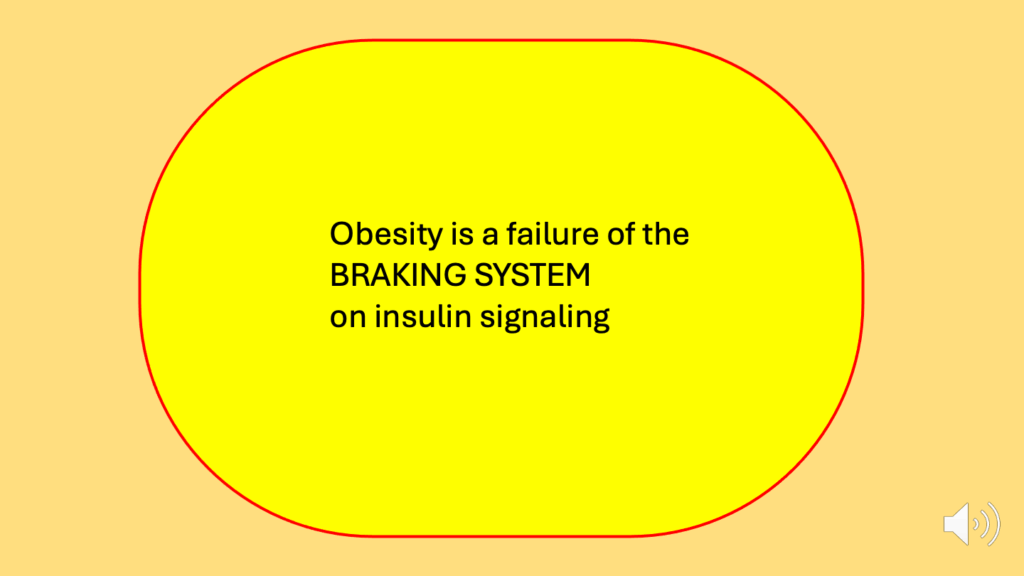
- The ROS hypothesis of obesity begins with the premise that obesity is a failure of the braking system on insulin signaling.
- Obesity is a failure of the braking system, which should be applied to insulin signaling (Figure 22).
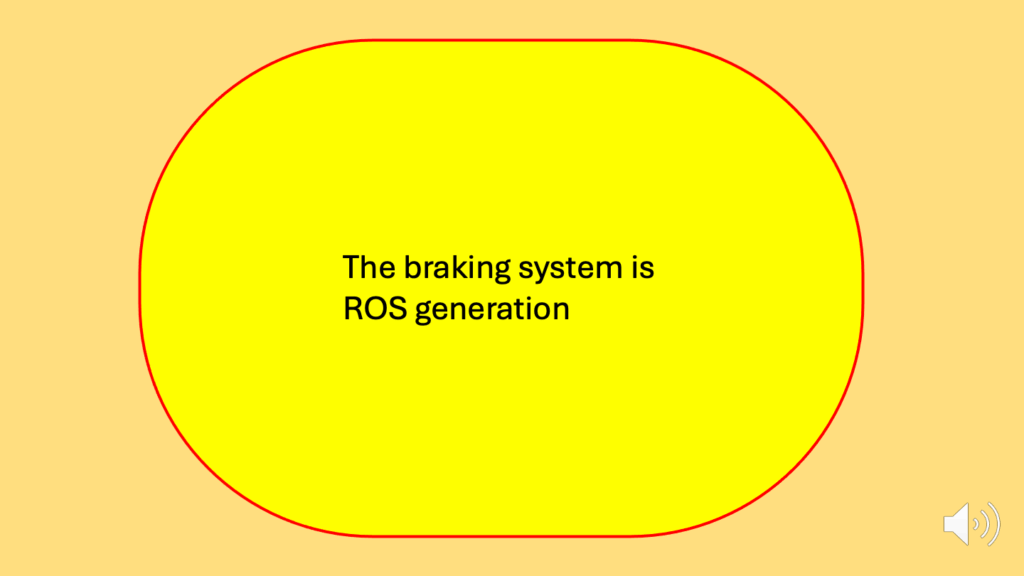
- The braking system on insulin signaling is mediated through ROS generation (Figure 23).
- Some fatty acids generate a better braking system than others (Figure 24).
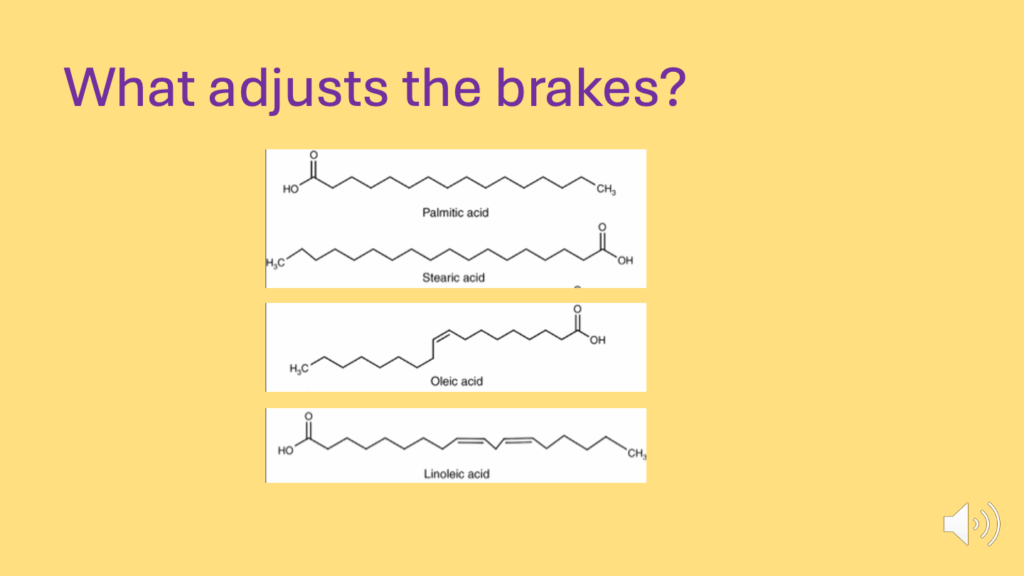
- What adjusts the brakes? The number of double bonds on fatty acids (Figure 25).
- Some fatty acids generate a better braking system than others:
- SFAs > MUFAs > PUFAs
- The ones that do it the best are the ones that generate the most ROS, the fully saturated fatty acids (SFAs) — palmitic and stearic acid.
- The monounsaturated fatty acids (MUFAs), like oleic acid, are not quite as good
- And the polyunsaturated fatty acids (PUFAs), particularly linoleic acid, are not good at generating ROS, so they’re very good at allowing insulin signaling to continue and allowing insulin signaling to store lipid in the lipid droplet.
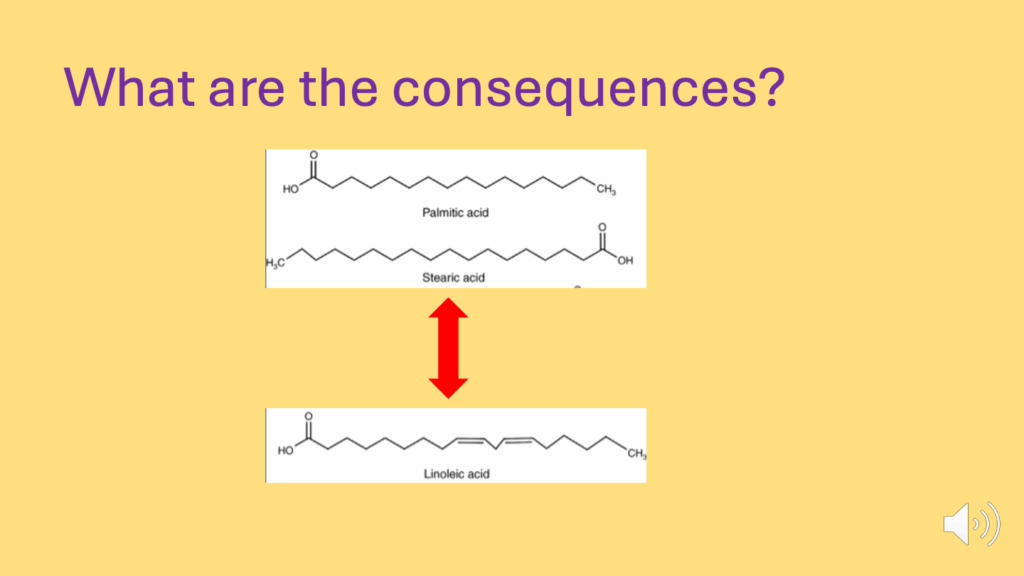
- What are the consequences of a lack of an adequate braking system (Figure 26)?
- If we look at the difference of running an adipocyte metabolism on saturated fat, or a polyunsaturated fat, over 24 hours:
- We only need a slight difference in net deposition of fat storage — 2-3 grams per day — into a 70 kg (or 70,000 g) human, for it to result in about a kilogram of excess fat storage per year.
- The ROS hypothesis of obesity posits:
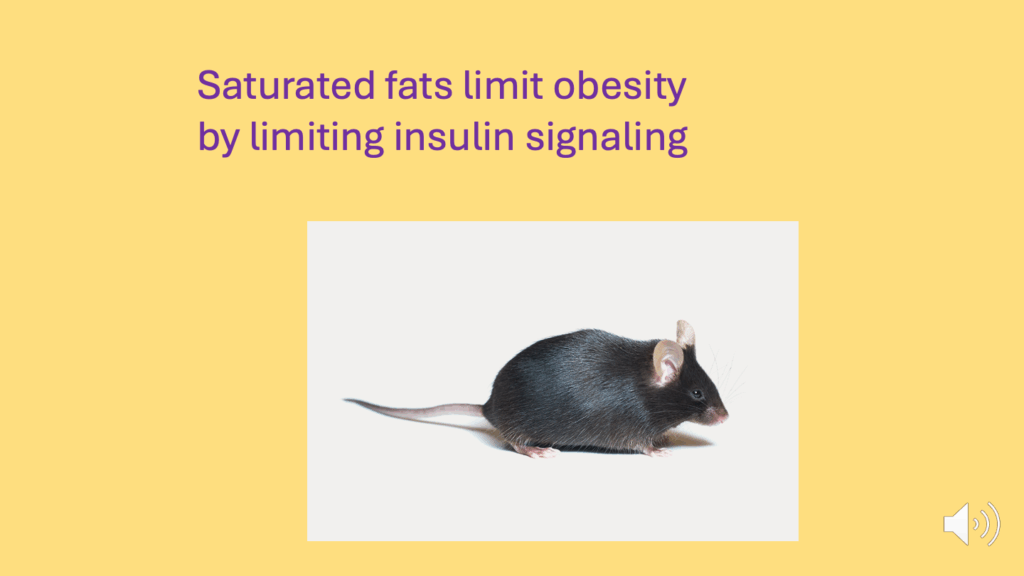
- SFAs limit obesity because they produce the best ROS signaling to inhibit the insulin signaling cascade (Figure 27).
- SFAs limit insulin signaling, and so limit fat storage.
- PUFAs do not generate such an effective ROS signal and facilitate obesity generation.
- PUFAs fail to limit insulin signaling, and so facilitate insulin-mediated fat storage.
- SFAs limit obesity because they produce the best ROS signaling to inhibit the insulin signaling cascade (Figure 27).
Further reading and resources
- MetFix | A primer on the ROS hypothesis of obesity
- MetFix | The ROS hypothesis of obesity
- MetFix | Webinar with Peter Dobromylskyj
Bob Kaplan is an independent research analyst. Bob previously served as director of research at Early Medical, contributing to The Drive podcast with Peter Attia and its other properties. Kaplan was a researcher at the Nutrition Science Initiative (NuSI), and an exercise physiologist at the University of Nevada, Las Vegas. His current and previous research interests include meta-research, chronic diseases, bioenergetics, exercise physiology, and nutrition.
Support the Broken Science Initiative.
Subscribe today →
recent posts
Journal Club: February 5, 2026
When number-chasing replaces treating the root cause
The iceberg beneath “normal” blood sugar numbers

