
By Malcolm Kendrick
A recent paper looked at a new method of calculating the future risk of atherosclerotic cardiovascular disease (ASCVD) – heart disease to you and me. It was called PREVENT (Predicting Risk of Cardiovascular Disease Events). The main finding was that using it “could greatly reduce the number of patients eligible for primary prevention statin therapy.”
As Stat News is reporting:
“Overall, 4% of people had a 10-year risk of developing cardiovascular disease, compared to the 8% previously predicted by the PCE (pooled cohort equations). The number of adults recommended for statins could drop from 45.4 million to 28.3 million.
Race, now recognized as a social not biological construct, was excluded in the newer equations. That meant 5.1% of Black adults were computed to be at risk, compared to 10.9% from the previous calculator. For older adults ages 70 to 75, the proportion at risk was 10.2%, down from 22.8%.”
Prediction – without which we do not have science
Over the years there have been many risk calculators for cardiovascular disease. The first was the Framingham Risk Score. In the UK there is currently QRISK along with the Joint British Society Risk Calculator (JBS3). There is also the ACC/AHA (American College of Cardiology/American Heart Association) calculator, WHO risk charts, a European Society of Cardiology risk score and on and on.
Which of these works best? The answer is… none of them. Which is probably why there are so many. Choose the one you like… and get a horribly inaccurate answer. Several years ago, researchers looked at the ACC/AHA risk calculator.
They followed 307,591 men and women, to see how their calculated risk scores matched the actual incidence of ASCVD over five years. (The number of cardiovascular CV events that actually occurred.)
“The actual incidence of atherosclerotic cardiovascular disease events over five years was substantially lower than the predicted risk in each category of the ACC/AHA Pooled Cohort equation:
-
- For predicted risk less than 2.5 percent, actual incidence was 0.2 percent
- For predicted risk between 2.5 and 3.74 percent, actual incidence was 0.65 percent
- For predicted risk between 3.75 and 4.99 percent, actual incidence was 0.9 percent
- For predicted risk equal to or greater than 5 percent, actual incidence was 1.85 percent
‘From a relative standpoint, the overestimation is approximately five- to six-fold,’ explained Dr. Go. ‘Translating this, it would mean that we would be over-treating a good many people based on the risk calculator.’”
At this point they should have taken that risk calculator and thrown it through the nearest window. It overestimated risk by four to five hundred percent!
At this point they should have taken that risk calculator and thrown it through the nearest window. It overestimated risk by four to five hundred percent!
Are the others any better? Sort of, a bit, perhaps. The European Society of Cardiology calculator works out your risk, then you have to establish if you are in a high-risk country, or a low-risk country. At which point you may have to multiply the score by two or divide by four depending on the country you live in. A score in France, for example, needs to be divided by four.
So, here is your adjusted risk, but it only works if you live in France, or Romania, or Italy. This is not scientific prediction; it is closer to astrology. It is fiddling about with models that have terrible predictive power. Take out various factors depending on how you feel. Or add them in, then run the model.
In this latest PREVENT study, for example, they decided to remove race as a risk factor. Why, because “it is a social not biological construct.” If you remove race, or ethnicity, you most certainly do reduce the (calculated) risk of people from certain racial groups. But have you actually reduced their risk? Nope, of course not.
All you have done is to present a more politically correct model. This is the exact opposite of science. ‘Because race/ethnicity is a social construct, we have got rid of it as a risk factor. Your risk has now gone down. Huzzah!’ To quote Ayn Rand (not something I would generally do, but this quote is so deliciously accurate in this case.) “You can ignore reality, but you can’t ignore the consequences of ignoring reality.”
The reality is that, in the US and in the UK, if you are from a non-white ethnicity, this greatly alters your risk of cardiovascular disease. If you are Asian Indian it is far higher. If you are African American, it is somewhat higher. If you have a Chinese ethnicity, it is far lower. This of course, could all change, and turn upside down over time. Because the impact of race is massively influenced by social, religious, environmental and psychological factors.
It has all turned into a complex mess. We have model, after model, that are about as useful as forecasting the weather tomorrow, based on the weather today. Yes, there is an eighty-five per cent chance that the weather tomorrow will be same as the weather today…or thereabouts. But knowing this provides no understanding of what causes different weather patterns. “Red sky at night, shepherds delight.”
Models based on no understanding of what causes cardiovascular disease
All the CV risk models, including PREVENT, do not rely on any understanding of what actually causes cardiovascular disease. They simply identify populations that are at higher CV risk, at a certain point in time. If you fit within that population, your risk is calculated to be higher.
Men are more at risk than women. Solution, create a model that places men at higher risk. Why are they at higher risk? Good question, but no-one can give you an answer.
Asian Indians are at far higher risk that Caucasians, at least currently, in the US. Why? Good question, but no-one can give you an answer. Family history also means you are at greater risk. Why? See above.
All these risk calculators do is to recognize a set of characteristics that are associations. Some may be causal, most are not. Then, depending on how many of these characteristics you have, they will calculate your risk. Using some complex mathematical model.
All these risk calculators do is to recognize a set of characteristics that are associations. Some may be causal, most are not. Then, depending on how many of these characteristics you have, they will calculate your risk. Using some complex mathematical model.
The PREVENT model, for example, added in obesity as a risk factor. Yes, obese people are at a higher risk than non-obese people – a bit. Why, because obesity is associated with insulin resistance and type II diabetes. It is the insulin resistance that is the problem, not the obesity. These factors do not exist in isolation.
So, what do you add into your model, what do you ignore? Below are two tables from the UK Biobank study. This is the largest genetic and population-based study ever attempted.
When it comes to CV risk factors, here are a few that they have identified. Male sex, physically inactive, current non-drinker, not married, or cohabiting, ever cigarette smoker, age and less than university education. [A Hazard Ratio of 1 means no added risk. That is the line down the middle. A hazard ratio above two is highly significant].
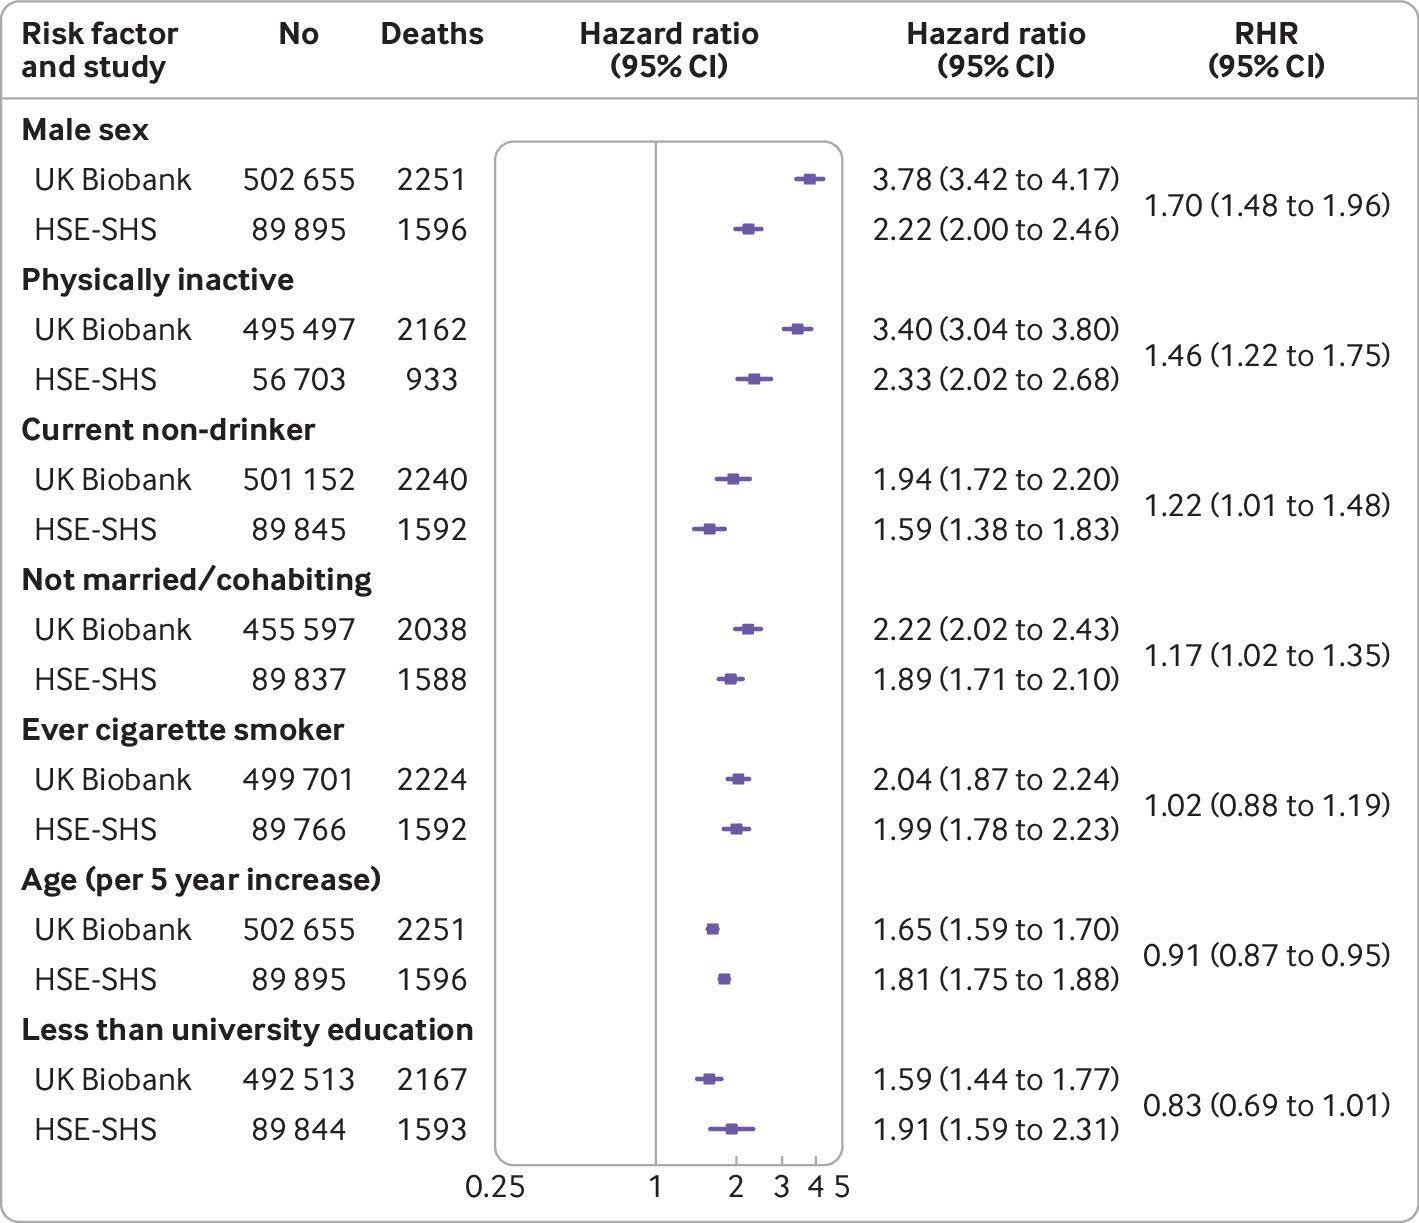
Should all these be in a risk calculator? Well, if you believe in risk calculators, almost certainly. But PREVENT only includes half of them. And there are so many more. Below (don’t worry, the print in table below is too small to read, as it has far too many figures in it. I only include it for illustrative purposes). This is the latest effort to determine risk factors. Published in Nature medicine.
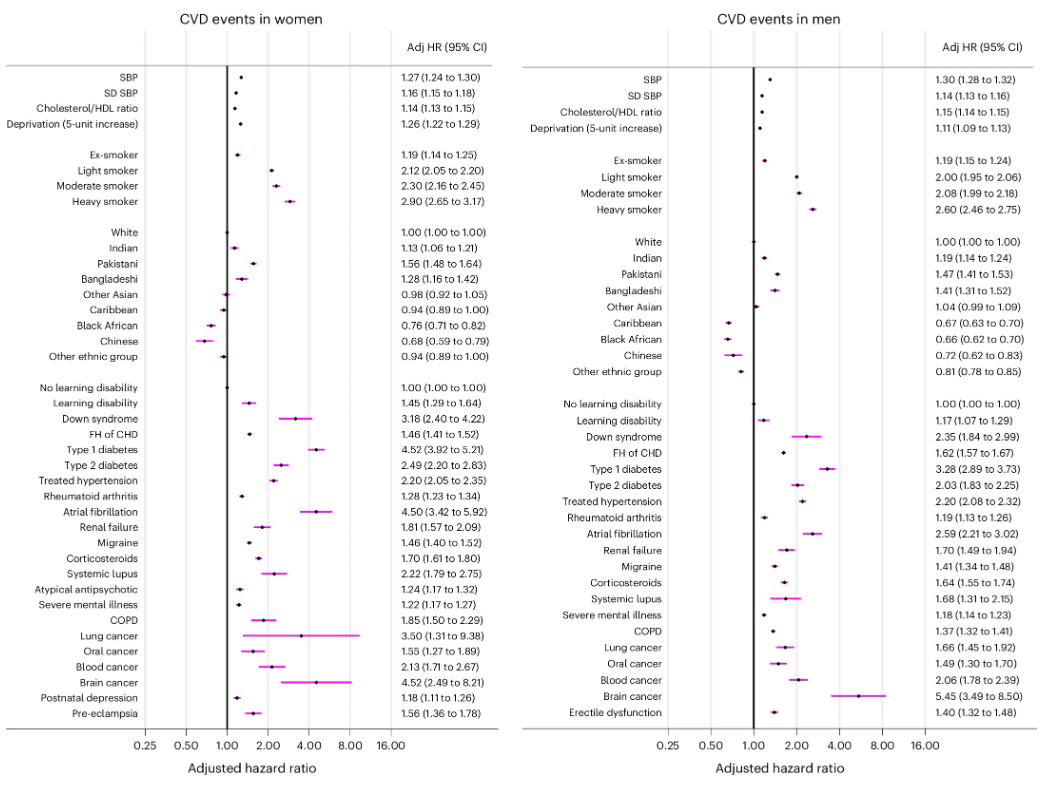
I’m afraid it does include many different ethnicities: White, Indian, Pakistani, Bangladeshi, Other Asia, Caribbean, Chinese. Other ethnic group… So, race is a social construct?
The uselessness of the risk calculators
Although it will be fervently denied by all involved. Risk calculators were primarily created in order that more people would take statins to lower their LDL/cholesterol, or other drugs to impact on other risk factors e.g. blood pressure.
Yes, statins are out of patent nowadays, so not much money is made from prescribing them. But this legacy of risk calculation remains. And we have newer, far more expensive LDL/cholesterol lowering drugs now. If you can calculate that someone is at very high risk, you can justify more expensive medications.
Perhaps they should have looked at the other figures from the Biobank study. Here we can see that many other things increased CV risk. The one thing that has absolutely no effect is the total cholesterol level.
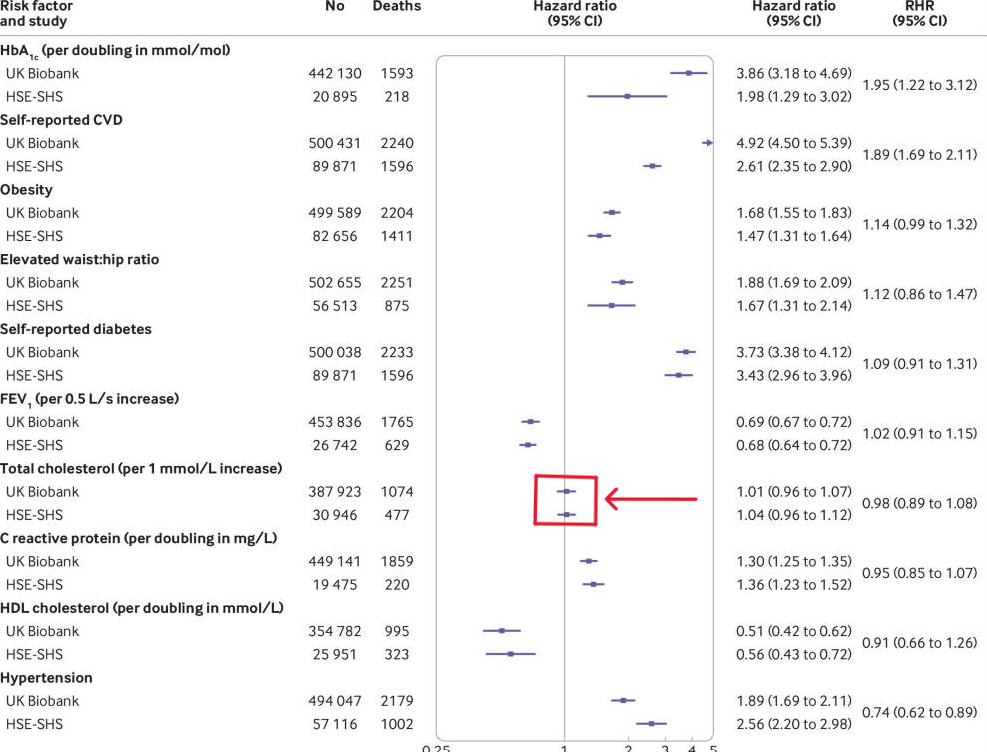
If you can actually read the Nature table, the one with very small writing, you will see that LDL does not figure, at all. They use the cholesterol/HDL figure. Which is actually another indicator of insulin resistance. However, even using a non-cholesterol figure, the increase in risk is so minute as to be utterly irrelevant. Yet, if figures in all the risk calculators that exist.
PREVENT is just another in a long line of useless risk calculators, designed to promote pharmaceutical interventions. They all overestimate risk because that way more people end up on drugs. They are not predictive, they are not scientific. In my opinion they should all be ignored.
Scottish doctor, author, speaker, sceptic

Support the Broken Science Initiative.
Subscribe today →
One Comment
recent posts
Flawed scientific thinking lies at the heart of postmodern scientific, medical, and institutional failures

Dr. Drew traces the roots of modern misinformation to scientific illiteracy and a growing intolerance for uncertainty, debate, and dissent.
How Broken Science Built the Chronic Disease Epidemic—and Why Education Is the Way Out


Half the time medics are refusing liothyronine (T3) at all, or adequate dosing of levothyroxine (T4) , because of the effect on your heart. Saying you will have a heart attack or stroke – often because your TSH will be too low.
Yet the QRISK3 calculator doesn’t contain a single question about thyroid.
You could have severe untreated Graves, or be plunging into a myxoedema coma. QRISK3 seems to think it makes no difference at all.
Strikes me that if a doctor is fixated on QRISK3, then they are claiming they know your risk. And your risk does not change whether you are hyper- or hypo-thyroid. Hence their favoured calculator gives no basis for their thyroid hormone treatment beliefs.
But if thyroid treatment can and does affect the heart, then they have to throw out QRISK3 because it ignores thyroid.
(In my view, severe hyperthyroidism does have heart implications, as does even mild hypothyroidism. But blanket T3 refusal, and TSH-only based prescribing doesn’t achieve minimisation of the risks.)